SOLIDWORKS Flow Simulation Semi-Truck Drafting and Drag Impacts
As SOLIDWORKS users, we know the power of simulation tools to answer practical, and sometimes just plain curious, questions about the world around us. In this article, I dive into a simple yet insightful aerodynamic study using SOLIDWORKS Flow Simulation. Ever wondered how closely following a semi-truck impacts the drag on your car and how this might affect fuel efficiency? This isn’t a high-tech wind tunnel experiment but it is a relatable, everyday scenario with some interesting findings.
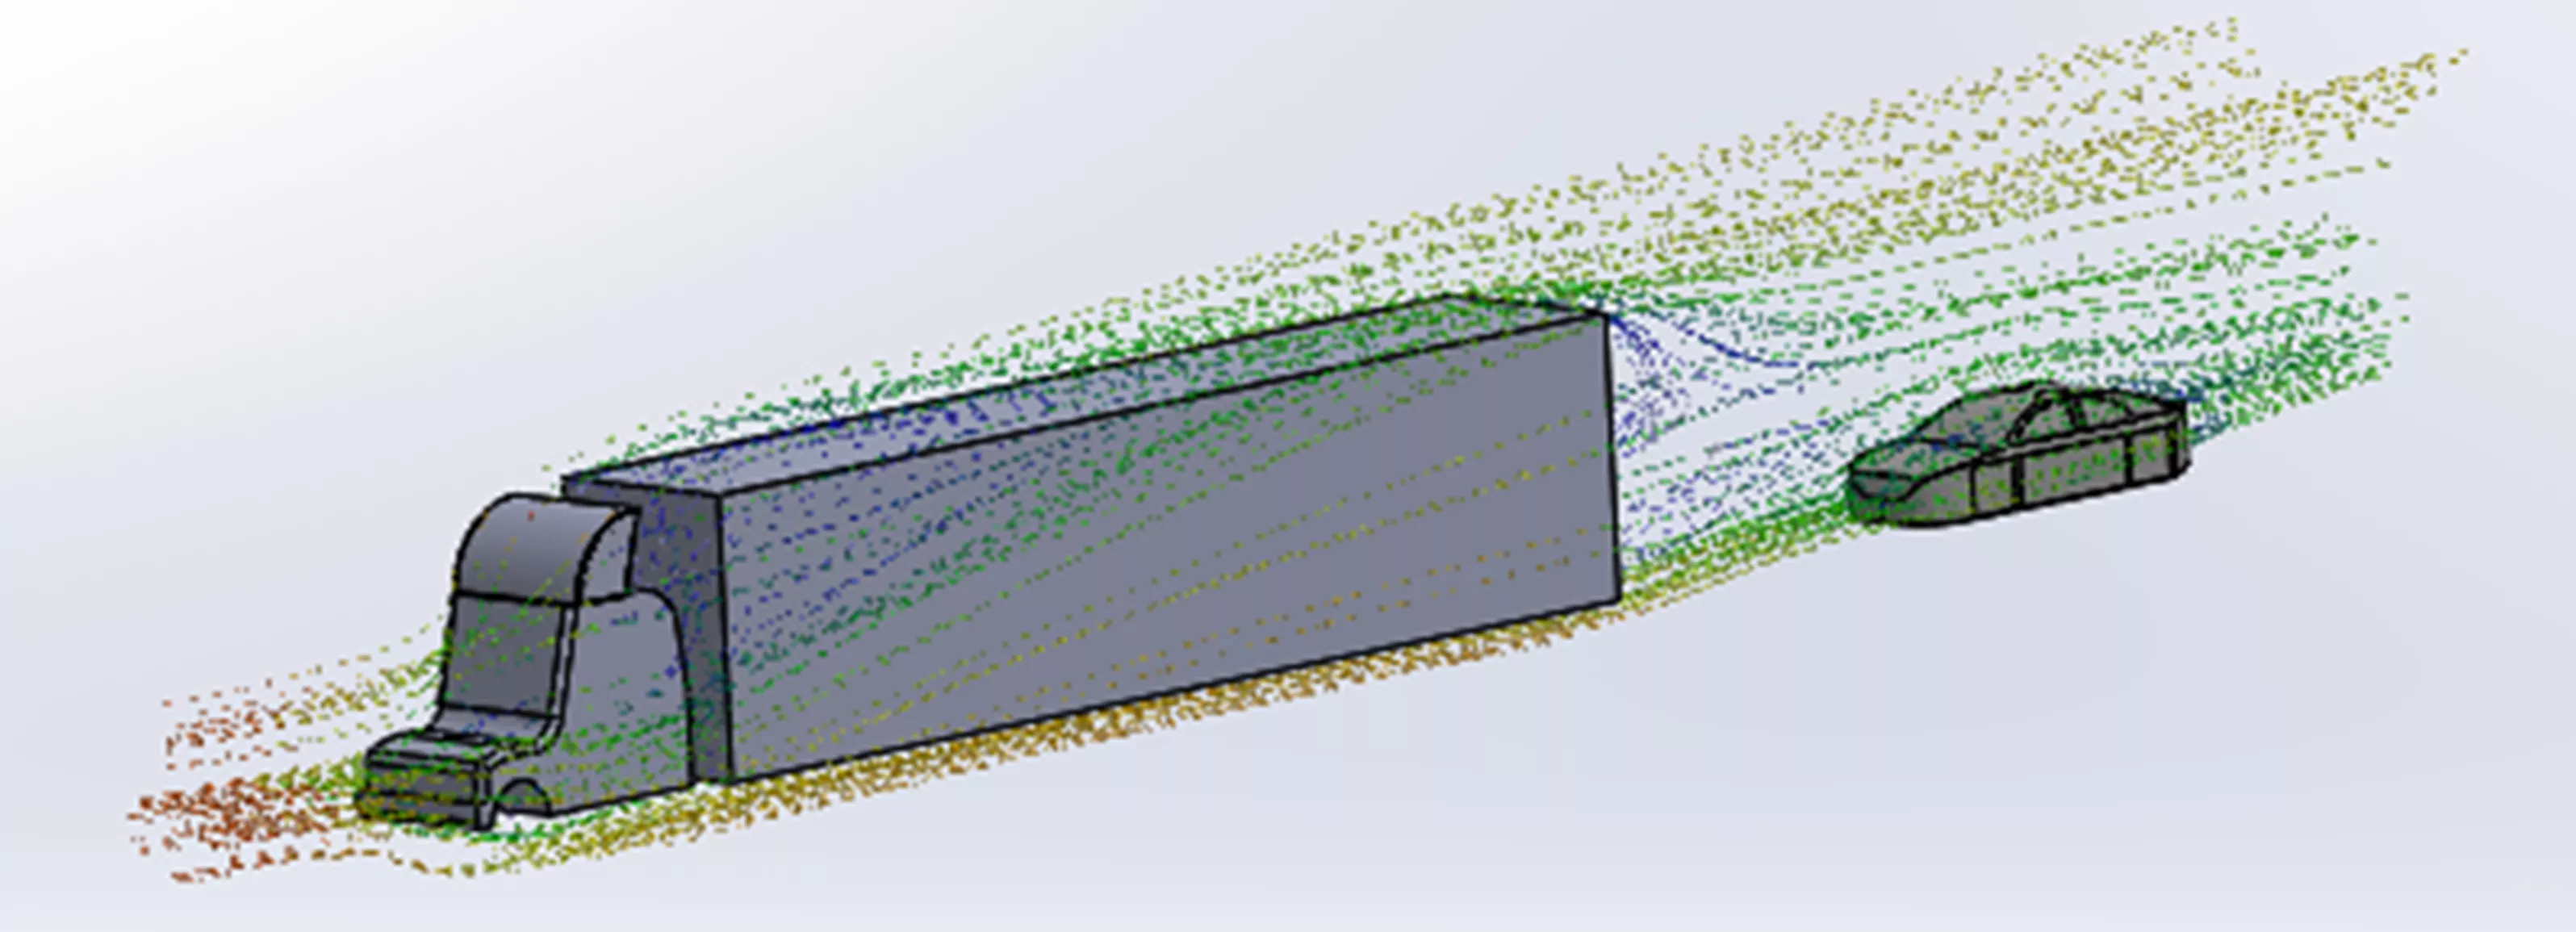
So, without further ado, let’s look at the setup for this case and results as we discuss the impact on drag and ultimately how this translates into fuel consumption next time you hit the road.
Semi-Truck Follow – The Science of Drafting
If you’ve been on a road trip or swapped driving stories, you’ve probably heard someone mention the idea of saving gas by following a semi-truck on the freeway. The logic seems sound: the truck slices through the air, leaving a smoother flow behind it. This is the essence of drafting, where a trailing vehicle rides in the low-pressure zone created by the lead vehicle, reducing aerodynamic drag and requiring less energy to maintain speed.
But how effective is drafting in a real-world setting? And just how close would you need to follow a semi-truck to see any noticeable difference? Using SOLIDWORKS Flow Simulation, it is easy to set up a simple study having a car follow a semi-truck at a constant speed (65 mph) while the follow-distance is varied from a cautious 60 feet to an eyebrow-raising 5 feet. Here’s how it goes:
Model a simplified semi-truck and car to-scale (multi-body part).
Align the car behind the semi creating a configuration for each distance.
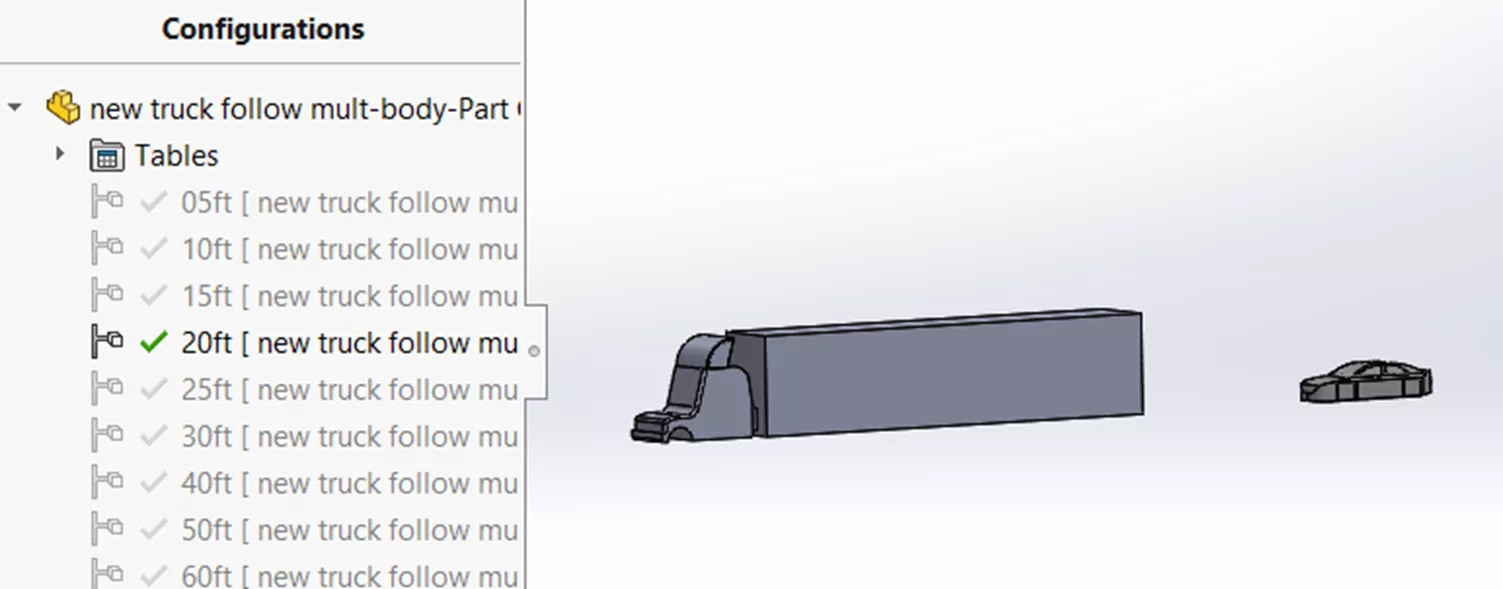
Initial Flow Settings:


Adjust Computational Domain:

Insert Surface Goals and Create Mesh:


Run a flow analysis for each configuration to determine the drag-force (lbf) on the car:
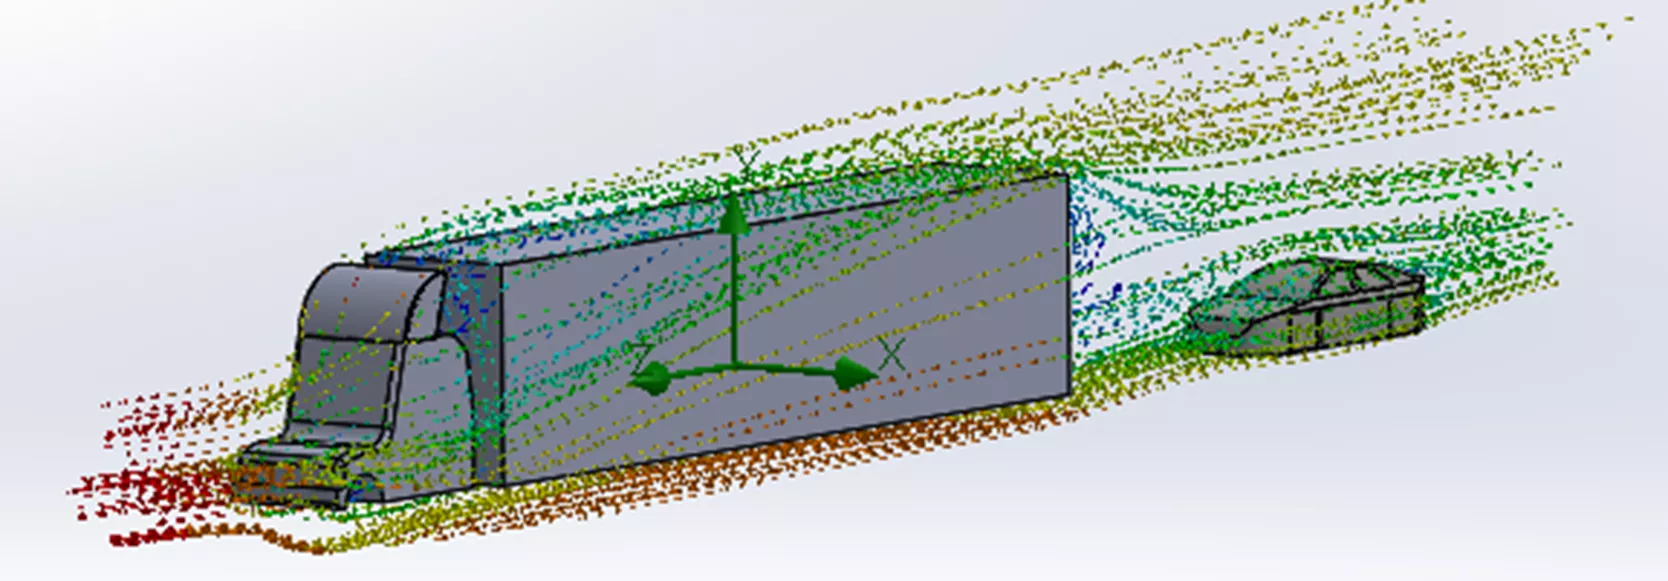
Plot results:
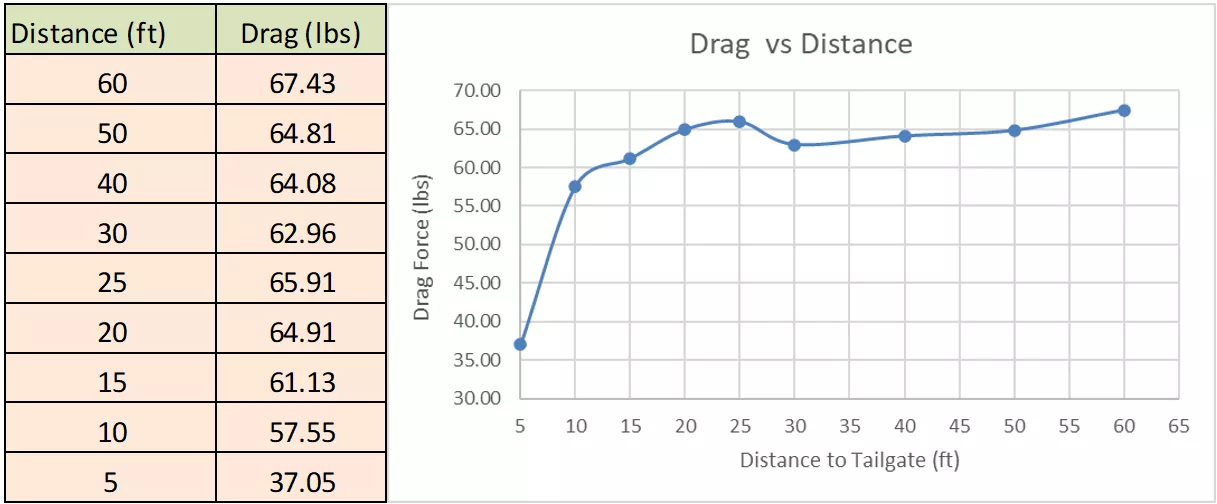
30 ft
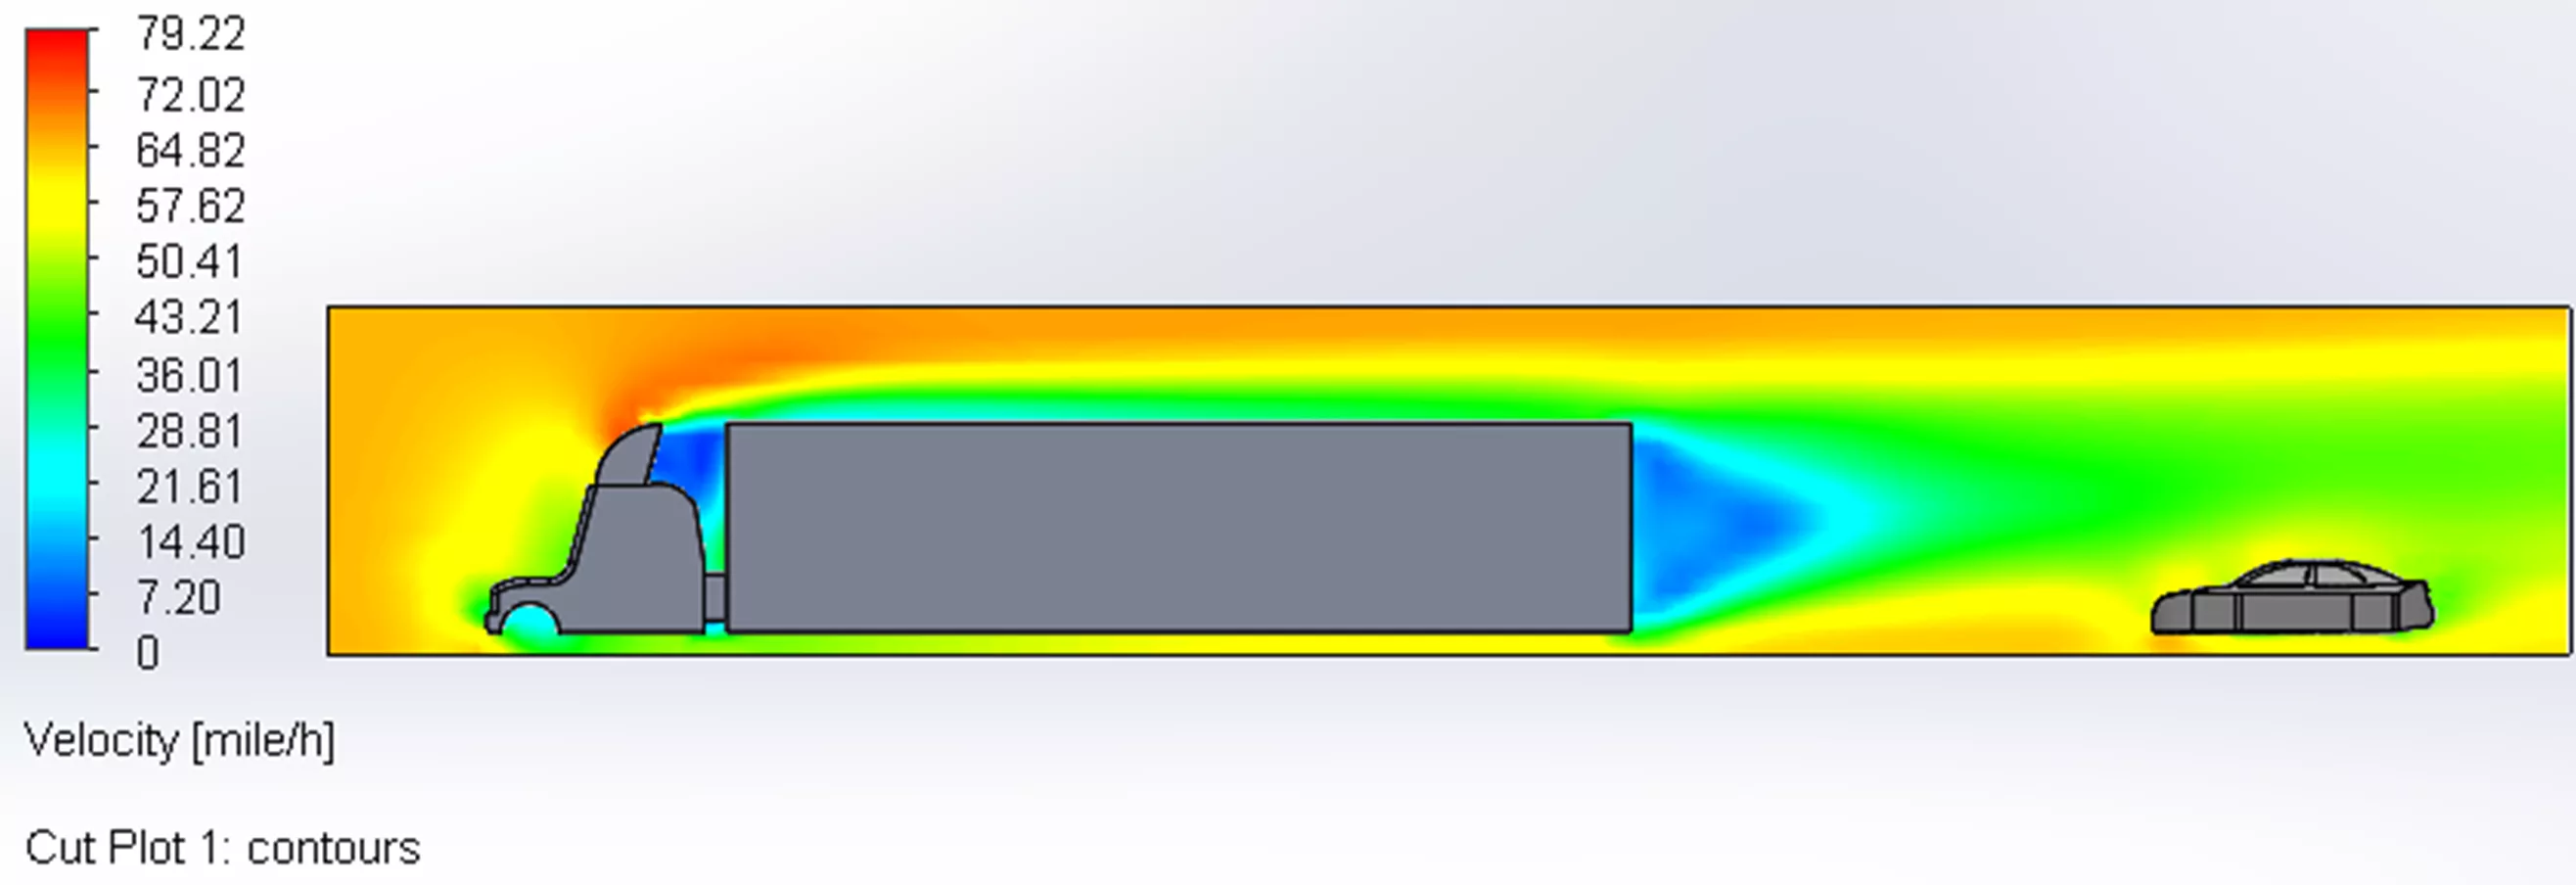
The results show some fascinating insights. At distances greater than 60 ft, the car experiences a drag force similar to open road conditions, with no noticeable impact from the truck. However, as the car moves closer, the drag force begins to drop slightly. Looking at the graph, between 60 ft and 30 ft – roughly two car lengths – there’s about a 6.6% decrease in drag.
To give some perspective, a 6.6% reduction in drag translates to about a 3.3% improvement in fuel consumption. For example, if your car normally gets 25 MPG, this would bring fuel efficiency to about 25.83 MPG. Over a 100-mile drive, this equates to saving approximately 0.13 gallons of gas, or about $0.50 at $4 per gallon.
So, although following a truck at 30 ft might gain a little aerodynamic advantage, let’s be real – it’s a pretty tight following distance at highway speeds and not worth the risk for what is saved in gas. And of course, while the drag force keeps dropping as the car gets even closer, down to half at 5 ft, this is purely academic – no one is actually going to follow that closely unless they’re racing in the Indy 500!
I hope you found this article interesting and illuminating as to how SOLIDWORKS Flow Simulation can be used for everyday curiosities.
Flow Simulation Training
Want to take your Flow Simulation skills to the next level? Our SOLIDWORKS Flow Simulation training course discusses the basics of turbulent fluid flow analysis, in addition to covering meshing concerns, modeling concerns, analysis, post‐processing, available options, and preferences. Both online and in-person options are available.
Related Articles
Outsmarting Drag Using SOLIDWORKS Flow Simulation
Testing Aquarium Filters Using SOLIDWORKS Flow Simulation
Winter Beehive Analysis Using SOLIDWORKS Flow & Thermal Simulation
SOLIDWORKS Flow Simulation Results Analysis Tools Explained
SOLIDWORKS Flow Simulation Free Surface and Gravity Dependency
About James Carlin
James Carlin is a SOLIDWORKS Technical Support Engineer at GoEngineer.
Get our wide array of technical resources delivered right to your inbox.
Unsubscribe at any time.

