Outsmarting Drag Using SOLIDWORKS Flow Simulation
Imagine it’s a hot summer day, and you’re driving down the freeway when your AC goes out – what to do? Roll down the windows to get some airflow, that’s what. But now, with all the air blowing around in the cabin, how does this affect gas mileage? When it comes to aerodynamics, seemingly small changes can have a significant effect on drag and fuel efficiency. In this article, SOLIDWORKS Flow Simulation will help determine how different window configurations on a generic sedan (fully closed, partially open, or fully open, etc.) affect overall drag. By comparing these scenarios, we can gain insights into how variations in drag on your car can translate directly into fuel consumption differences.
In this example, I have a simple car model built to scale. Since I am only interested in relative changes in drag/friction forces, I do not need a lot of detail in my model.
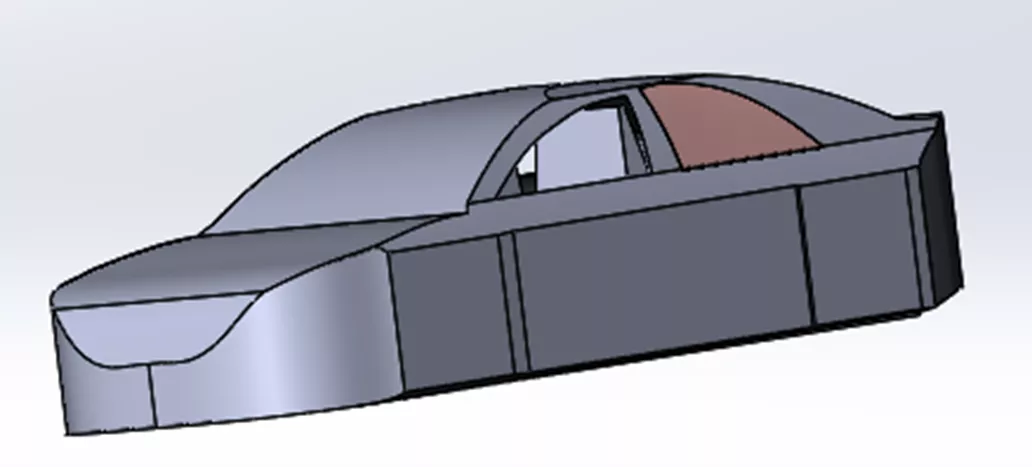
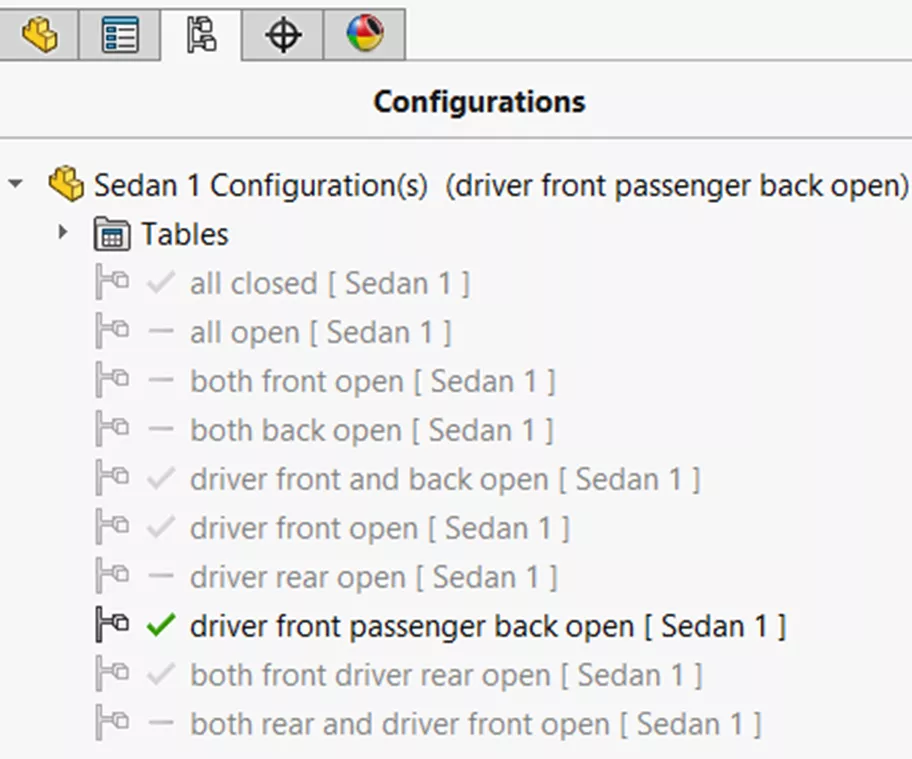
Next, I'll create configurations of the different window positions (e.g., all closed, all open, etc.).
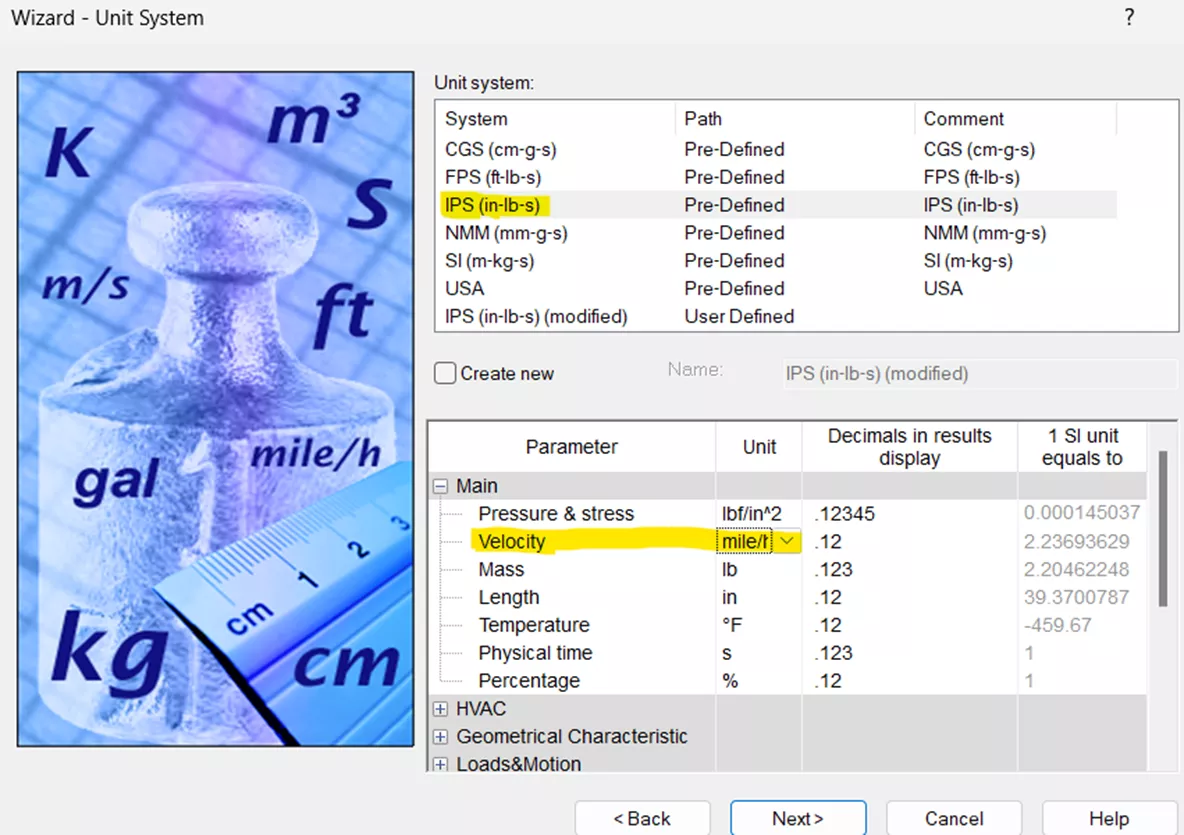
Now that I've finished the model, I can get into the study. The SOLIDWORKS Flow Wizard setup walks you through all of the parameters. For this test, I used IPS(in-lb-s). My units for Velocity were mph, and Drag Force was set to pounds (lbs).
The Analysis type is set to External flow.
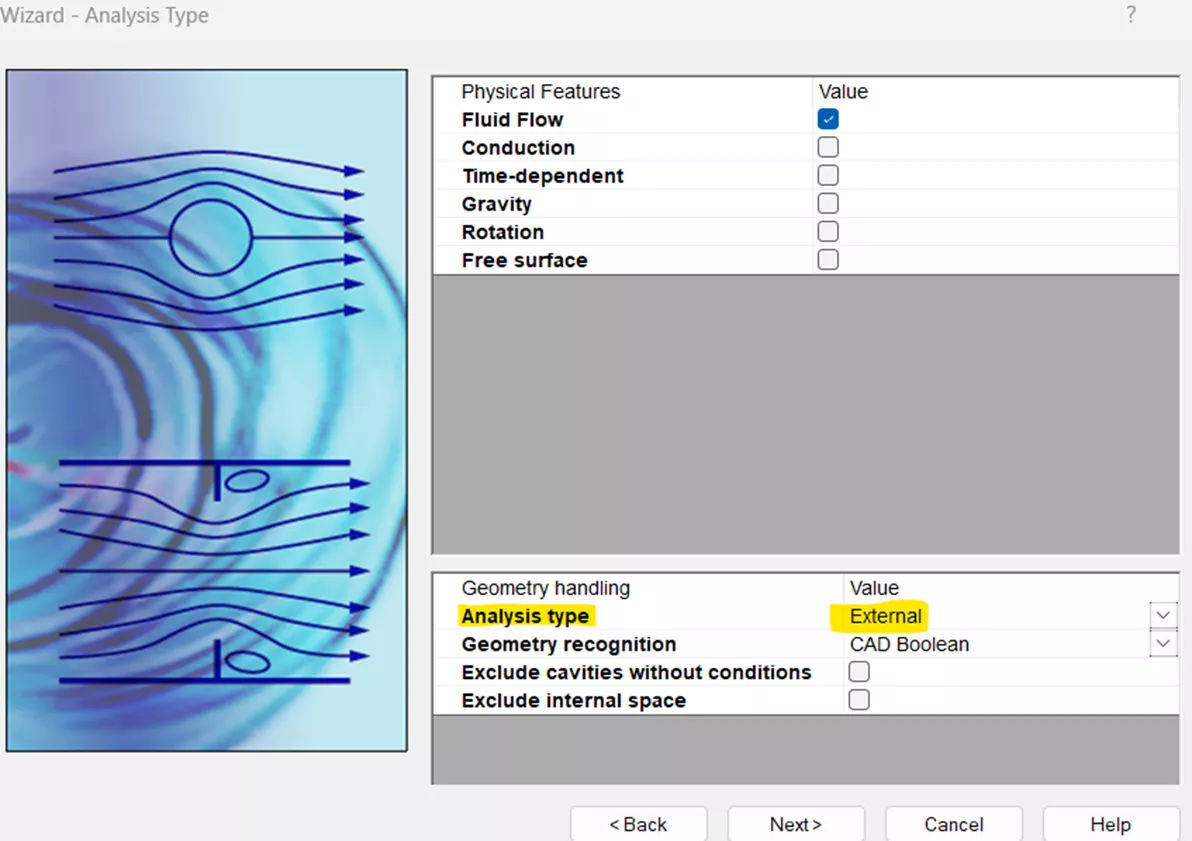
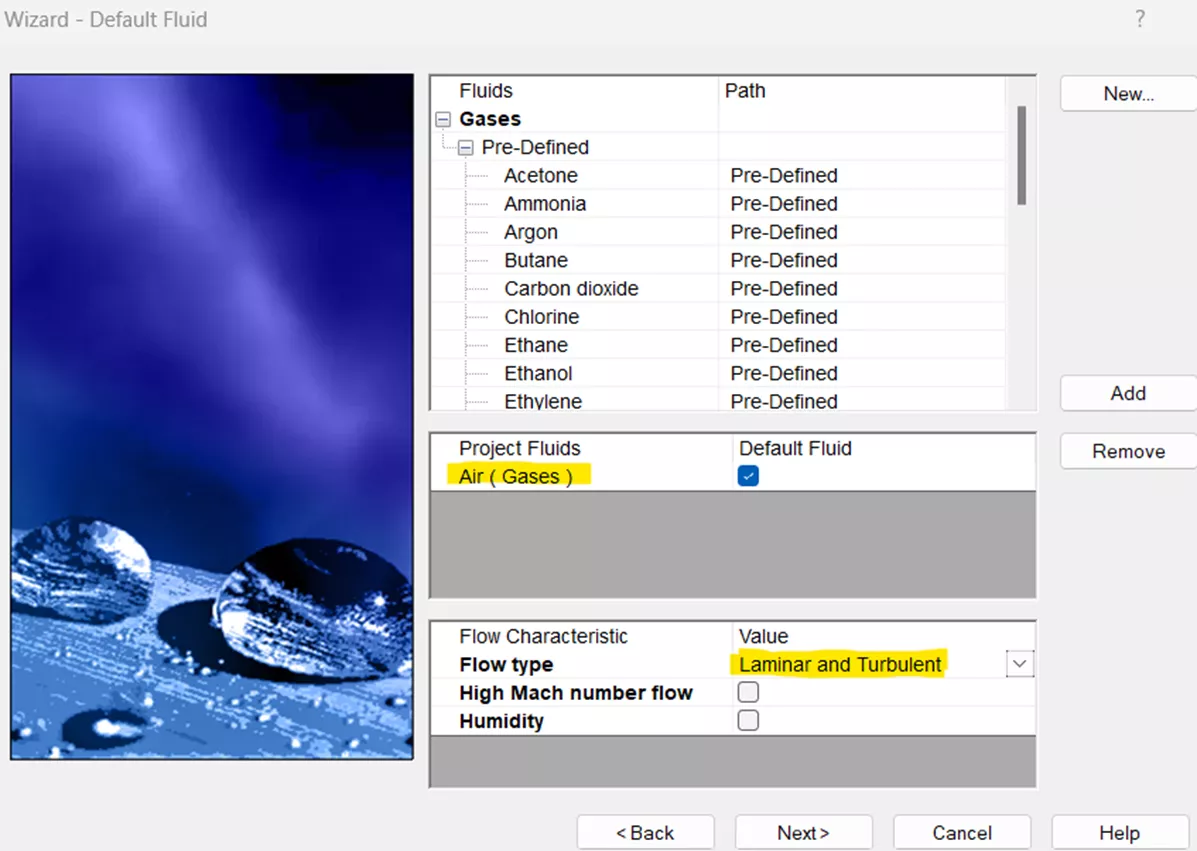
Since I'm treating this like a normal drive, the default Fluid was set to Air (Gases) with Laminar and Turbulent flow.
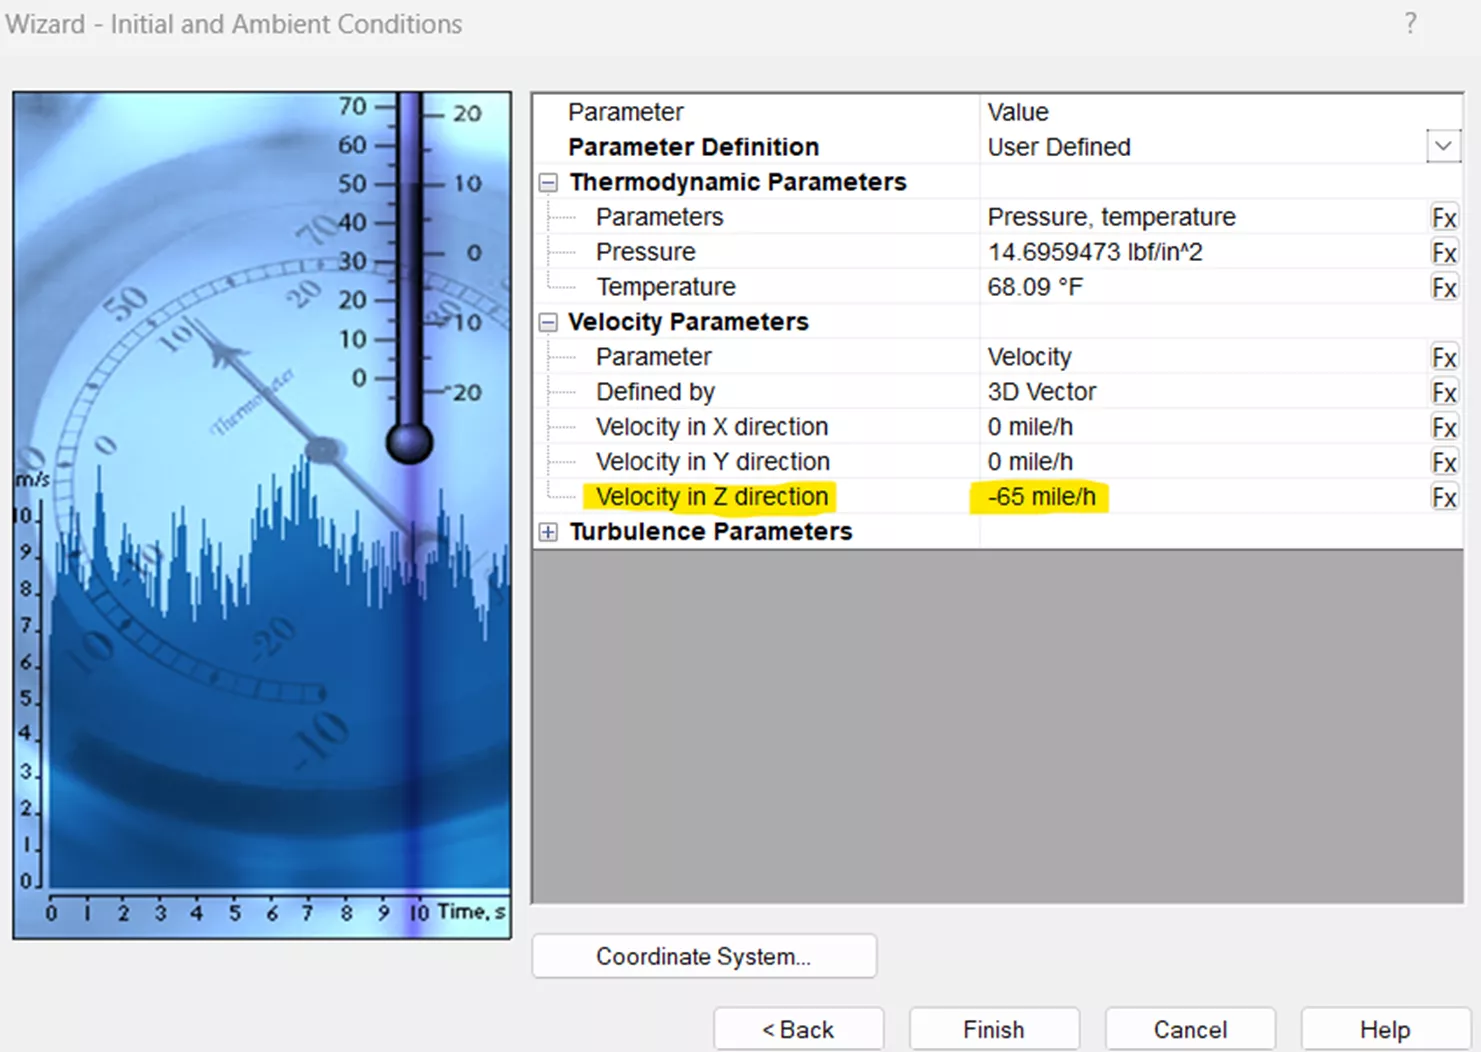
To simulate highway driving, I set the velocity of travel for all configurations to -65 mph in the Z-direction. Since velocity is a vector, the direction component of the vector is controlled by a positive/negative value.
Now that the preliminary settings are entered, I can move on to the actual Flow study setup.
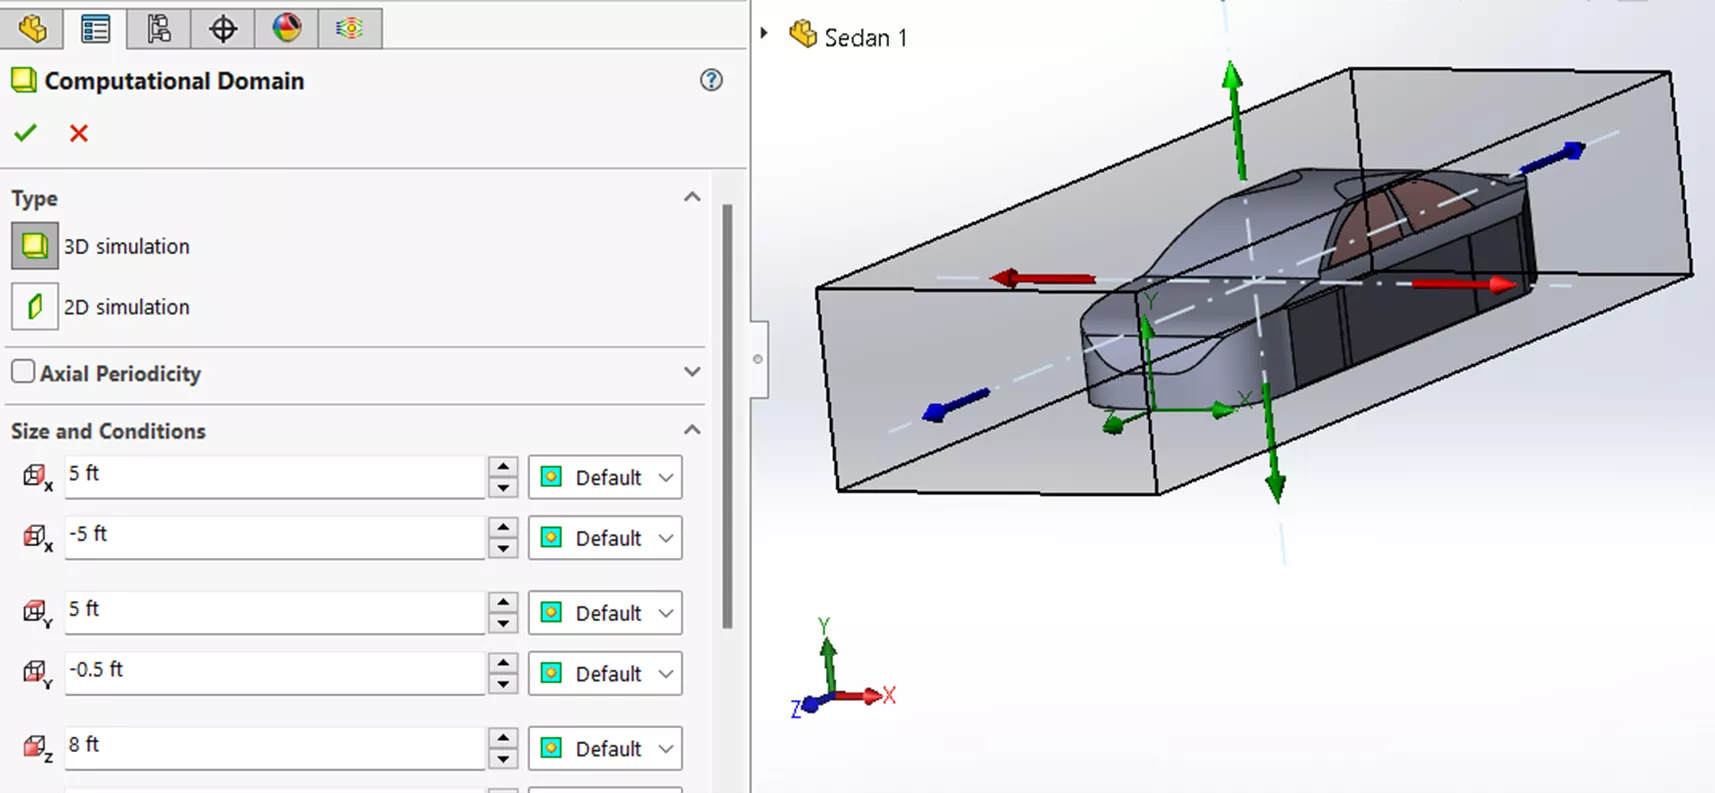
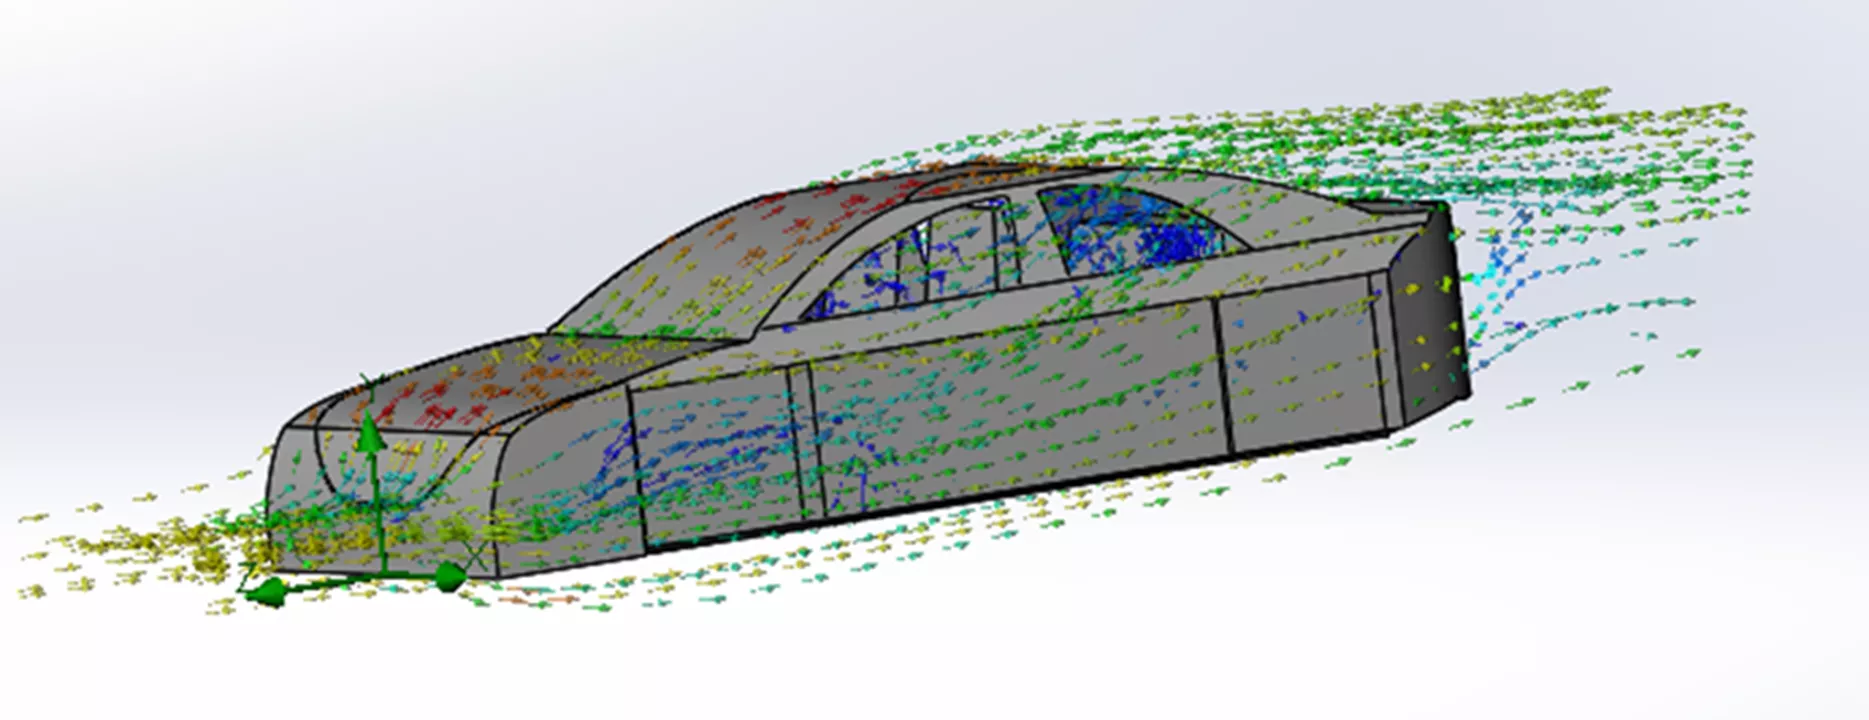
Here, I will establish a computational domain (the space where flow conditions are calculated).
To keep things simple, I will only extract Z-direction forces (wind drag and friction) that act on the surfaces highlighted in blue. Therefore, I can leave the forces in X and Y unchecked.
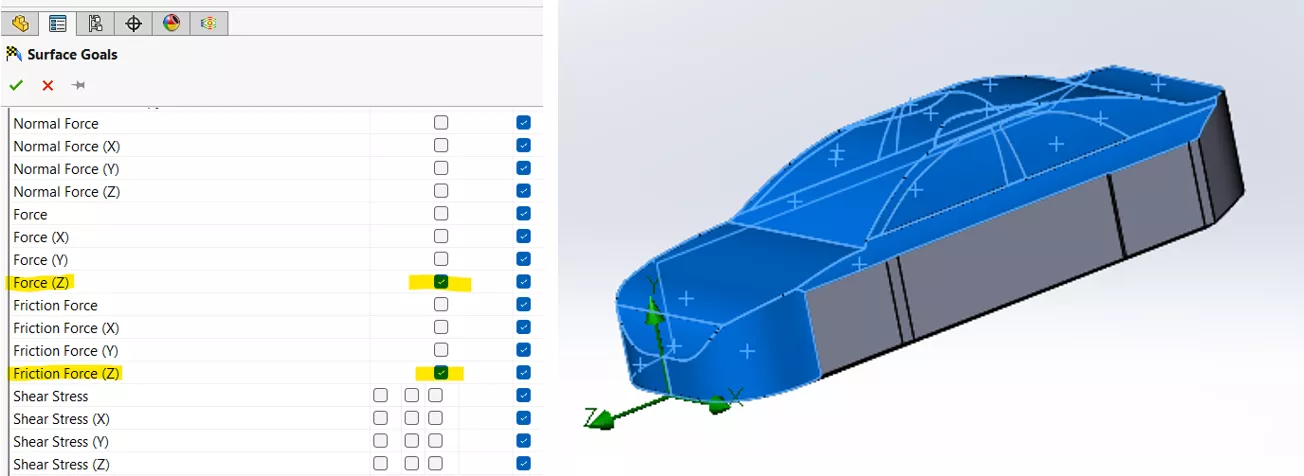
Note: It is important to select the same surfaces for each configuration you run in Flow so that you get the most accurate comparison.
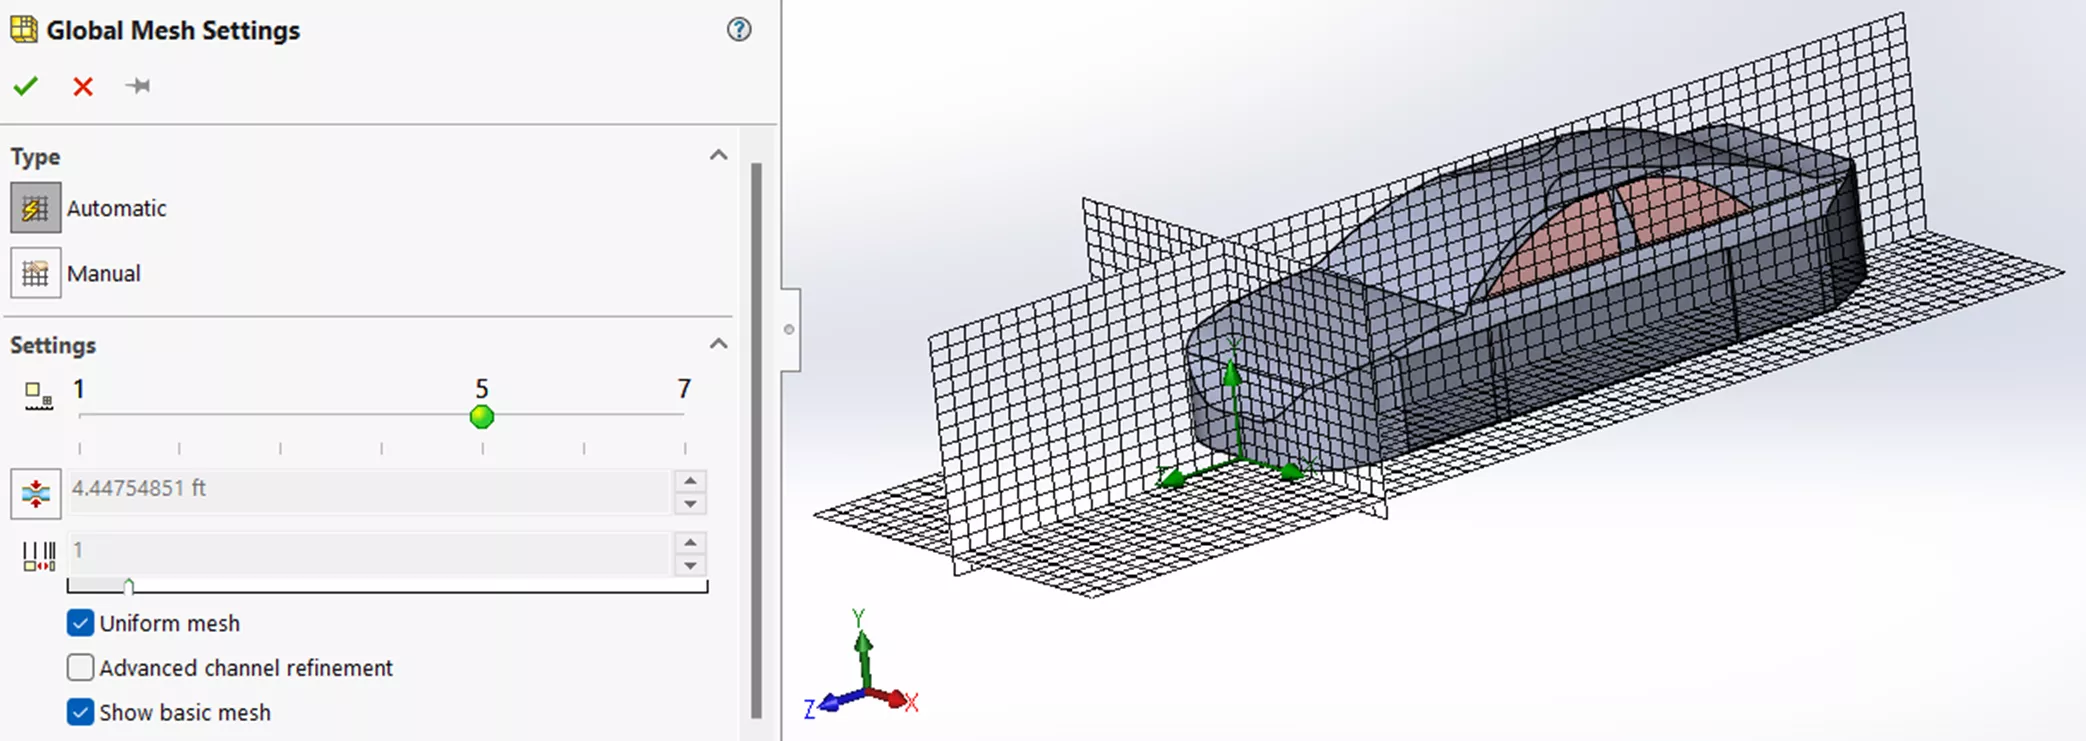
Lastly, I need to establish a basic global mesh. Here, the accuracy level is set to 5. If it is set higher, the overall results may be more accurate, however, the solve-time will increase, so 5 should help strike a balance.
After running the same setup for each of the 10 configurations, let’s look at the results. The Total Drag value in my analysis is the sum of the averaged Drag and Friction forces (in negative Z-direction).
All Closed
| Goal Name | Unit | Value | Averaged Value |
| SG Force (Z) 3 | [lbf] | -62.51 | -62.47 |
| SG Friction Force (Z) 4 | [lbf] | -3.58 | -3.56 |
| Total Drag: -66.03 |
| Driver Front_Both Rear Open | Total Drag: | -73.46 |
| All Open | Total Drag: | -73.39 |
| Driver Front_Passenger Rear Open | Total Drag: | -71.33 |
| Both Front_Driver Rear Open | Total Drag: | -70.60 |
| Both Rear Open | Total Drag: | -69.90 |
| Driver Rear Open | Total Drag: | -69.27 |
| Driver Front Open | Total Drag: | -68.45 |
| Driver Front_Driver Rear open | Total Drag: | -68.35 |
| Both Front Open | Total Drag: | -68.27 |
A hand calculation using the drag force equation shows that the Flow results are reasonable.
Fd = .5 · Cd · p · A · v2 ~ -73.69 lbf
Discussion
As expected, the lowest drag force occurs when all windows are closed: -66.03 lb. I also expected the largest drag to happen when all windows are open, however this is not the case. The largest drag happens when the Driver Front and Both Rear windows are open: -73.46 lb. Although the difference is small between configurations DFBRO and All Open, it’s still an unexpected result. It also appears that the rear windows being open contribute more to the drag forces than front windows.
According to an auto industry rule of thumb, drag forces acting on a vehicle traveling within the range of 55 – 75 mph correspond closely with respective fuel consumption. For example, the percent increase from lowest to highest drag force on our test model traveling at 65 mph is approximately 11.25%. This means fuel consumption also increases by roughly 11.25% in the DFBRO configuration.
On a final note, it’s worth pointing out that drag force also changes with how fast a car is going. The following data was generated by SOLIDWORKS Flow Simulation using the All Closed model configuration:
| mph | drag |
| 50 | 38.90 |
| 55 | 46.91 |
| 60 | 55.97 |
| 65 | 66.04 |
| 70 | 76.87 |
| 75 | 88.24 |
| 80 | 100.46 |
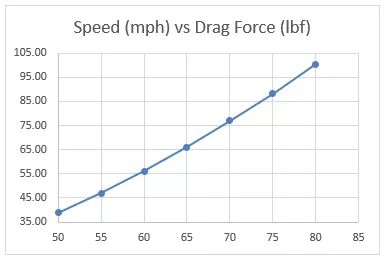
According to this data, increasing speed from 65 to 75 mph increases drag by a whopping 33.6% which corresponds to approximately the same percentage in fuel consumption. To put this in perspective, if your car gets 30 miles to the gallon, it would drop to about 22 mpg in this scenario. This makes sense if you consider that the drag equation indicates an exponential relationship between Drag Force and Velocity.
Fd ~ v2
By leveraging SOLIDWORKS Flow Simulation, we’ve uncovered how drag force varies with different vehicle configurations and how these changes directly impact fuel efficiency. Although it was a simplified approach, I hope this article gave some interesting insights and highlighted how well SOLIDWORKS Flow can be utilized for fun thought projects like this.
Flow Simulation Training
Want to take your Flow Simulation skills to the next level? Our SOLIDWORKS Flow Simulation training course discusses the basics of turbulent fluid flow analysis, in addition to covering meshing concerns, modeling concerns, analysis, post‐processing, available options, and preferences. Both online and in-person options are available.

More Flow Simulation Tutorials
What is SOLIDWORKS Flow Simulation Used for? Top 5 Use Cases
SOLIDWORKS Flow Simulation Results Analysis Tools Explained
SOLIDWORKS Flow Simulation Free Surface and Gravity Dependency
SOLIDWORKS Flow Simulation Carbon Monoxide Flow Tracer
Winter Beehive Analysis Using SOLIDWORKS Flow & Thermal Simulation
About James Carlin
James Carlin is a SOLIDWORKS Technical Support Engineer at GoEngineer.
Get our wide array of technical resources delivered right to your inbox.
Unsubscribe at any time.