Comparing All SOLIDWORKS Simulation Packages: Basic to Advanced
SOLIDWORKS offers four distinct levels of simulation. The most basic simulation package offered is found within the 3D design package called SOLIDWORKS Premium. More advanced simulation tools can be found in Simulation Standard, Simulation Professional, and Simulation Premium.
Each tier of SOLIDWORKS Simulation packages includes more advanced capabilities as you move up in each package (the higher-level packages include all the features of the previous levels). In this blog, we will compare all tiers of SOLIDWORKS Simulation packages and see examples so you can determine what level of SOLIDWORKS Simulation is best for you and your company.
SOLIDWORKS PREMIUM
Simulation Features in SOLIDWORKS Premium:
- Static Linear Analysis of Parts and Assemblies
- Motion (Kinematic) Analysis
SOLIDWORKS Premium offers the full capabilities of linear static analysis on both parts and assemblies, from which you can plot stresses, strains, displacements, and more. The package also offers the ability to fully animate your assemblies to find results such as forces, momentum, energy, power, velocity, and accelerations between moving components.
Why SOLIDWORKS Premium?
If your company develops load-bearing and movable designs, then SOLIDWORKS Premium will pay for itself, if you build expensive prototypes to determine if your designs will fail.
Consider a linear static analysis of a trunnion assembly. Trunnions are part of a rotating joint where a shaft is inserted into a full or partial cylinder. By applying materials, hinge fixtures, and a 5,000 pound load, we can quickly find where the highest stresses and displacements occur. We can also analyze plots of the Factor of Safety, which are especially important to know to build a certain amount of safety into our designs. (Figure 1)
Imagine the time and money your company can save using a comprehensive linear static analysis tool to quickly identify potential design failures, eliminating the need to build costly prototypes to uncover weak points in the design.
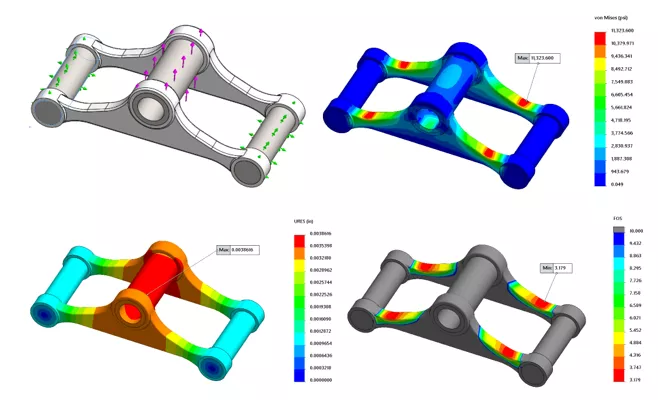
Figure 1: Linear FEA Setup and Results
This next example involves the physical movement of a valve cam assembly, where the focus is analyzing the reaction forces that exist between the cam and the rocker arm.
A Motion Analysis can accurately simulate and analyze the effects of motion elements (including forces, springs, dampers, and friction) on an assembly. After performing a motion study on the valve cam assembly, we can easily create a plot to observe the reaction forces that exist where the cam and rocker arm encounter each other during the movement. (Figure 2)
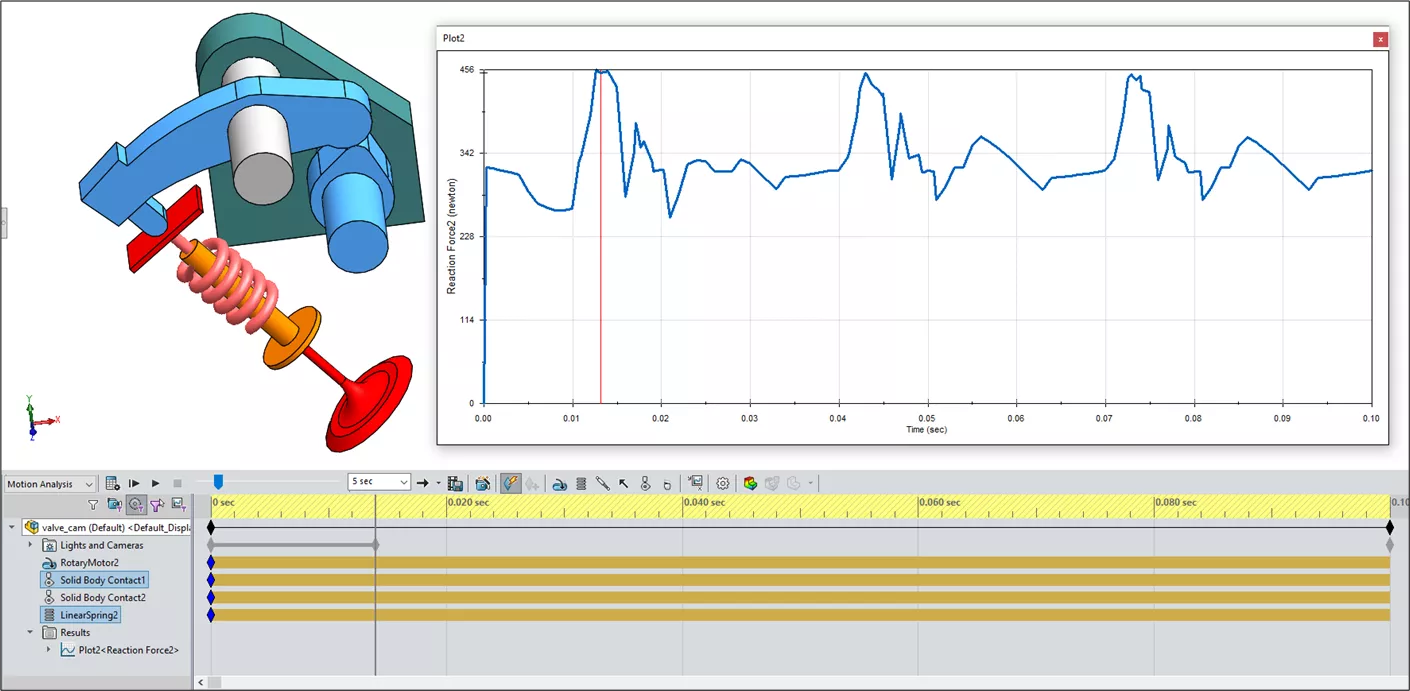
Figure 2: Motion Study Results
SOLIDWORKS Simulation Standard
Simulation Features in SOLIDWORKS Simulation Standard:
- Static Linear Analysis for Parts and Assemblies
- Motion (Kinematic) Analysis
- Fatigue Analysis (High Cycle Constant and Variable Amplitude)
- Trend Tracker
SOLIDWORKS Simulation Standard is the next level of simulation that unlocks not only the simulation capabilities in SOLIDWORKS Premium but also the ability to perform constant or variable amplitude Fatigue Analyses. It also includes a tool called Trend Tracker that allows you to find trends in your simulation results.
Why SOLIDWORKS Simulation Standard?
Whether your company designs for strength or designs for life, the Fatigue Analysis tool in Simulation Standard can quickly show the number of cycles or blocks that would cause failure in your designs. It can also show the number of cycles to when your designs will fail and the percentage of life consumed by your defined fatigue event input.
You can also find the load factor of safety for fatigue failure and plot the biaxiality indicator which helps in determining a fatigue strength reduction factor for your studies.
(See Figures 3 and 4 for plot examples from a Fatigue Analysis.)
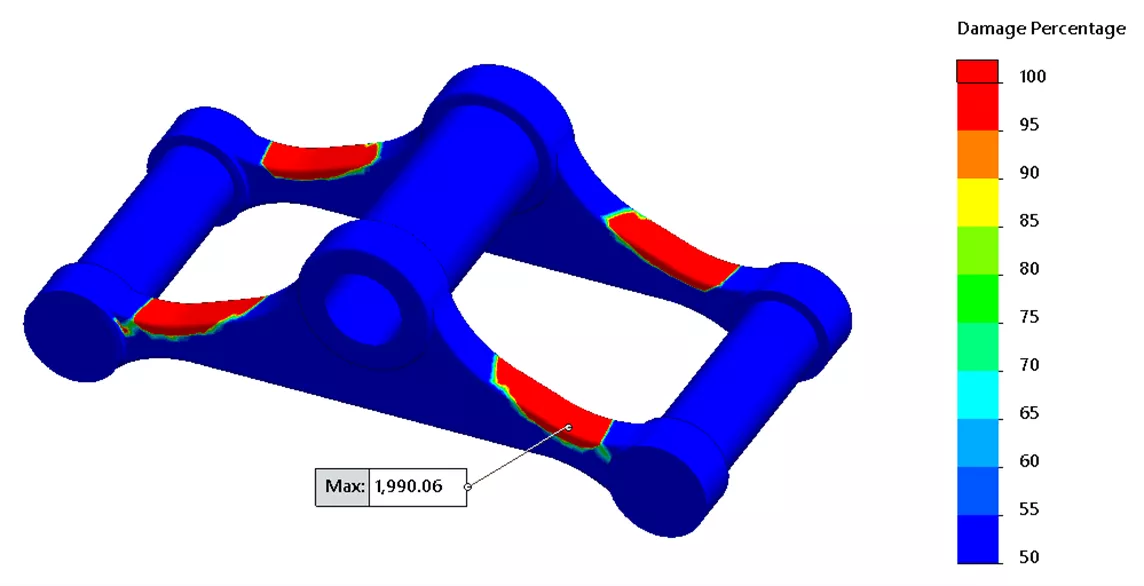
Figure 3: Damage Percentage Plot
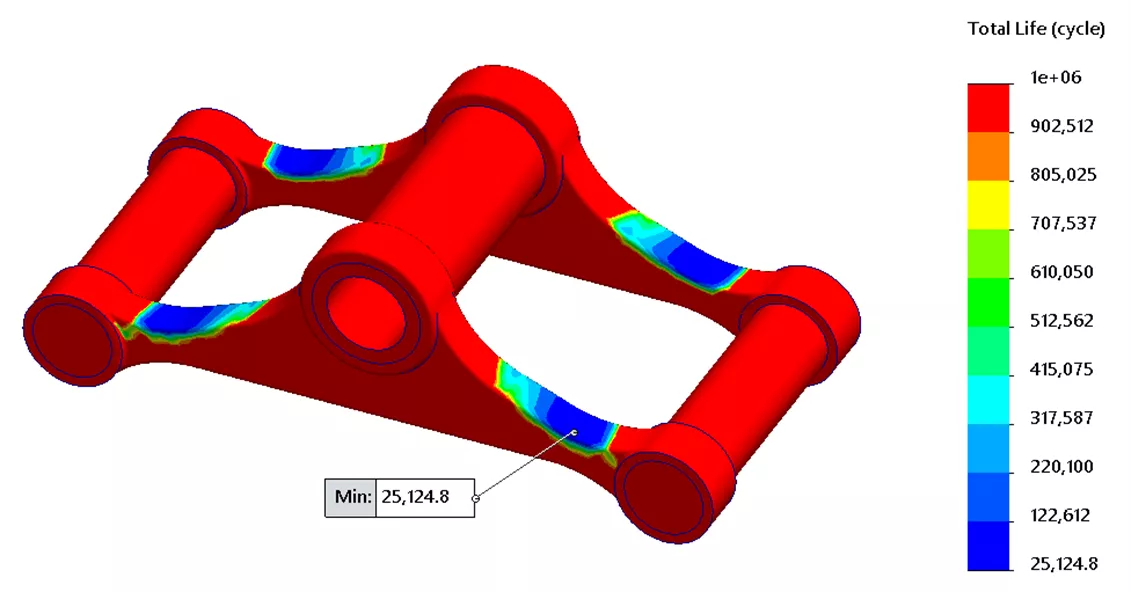
Figure 4: Minimum Total Life Cycle Plot Expectancy Plot
FEA Analysts often look for trends in results when running several different simulation runs on their designs. Trend Tracker allows your company to track trends in your existing static studies. You set a baseline point to compare to future results.
Take, for example, the model in Figure 5. We can modify certain features after setting the baseline design to graphically view the changes in weight and stress results. (Figure 6). You can also view a trend journal document that reveals not only your simulation results but a percentage value comparison of results from your baseline simulation run. (Figure 7)
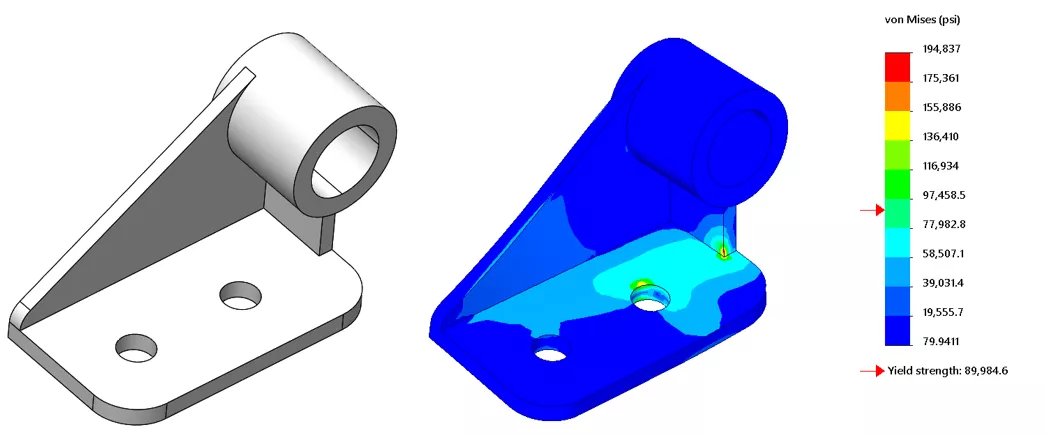
Figure 5: Model and Baseline Simulation Stress Result
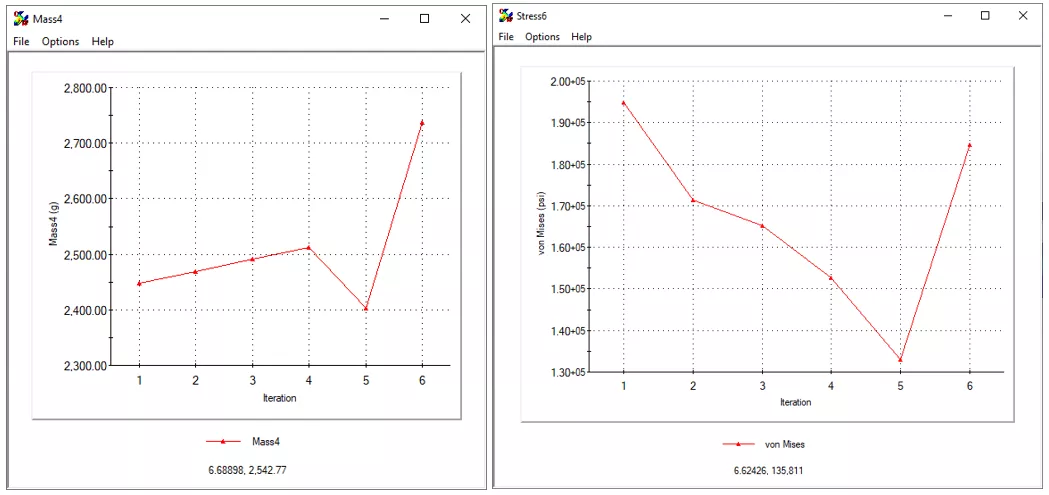
Figure 6: Motion Study Results
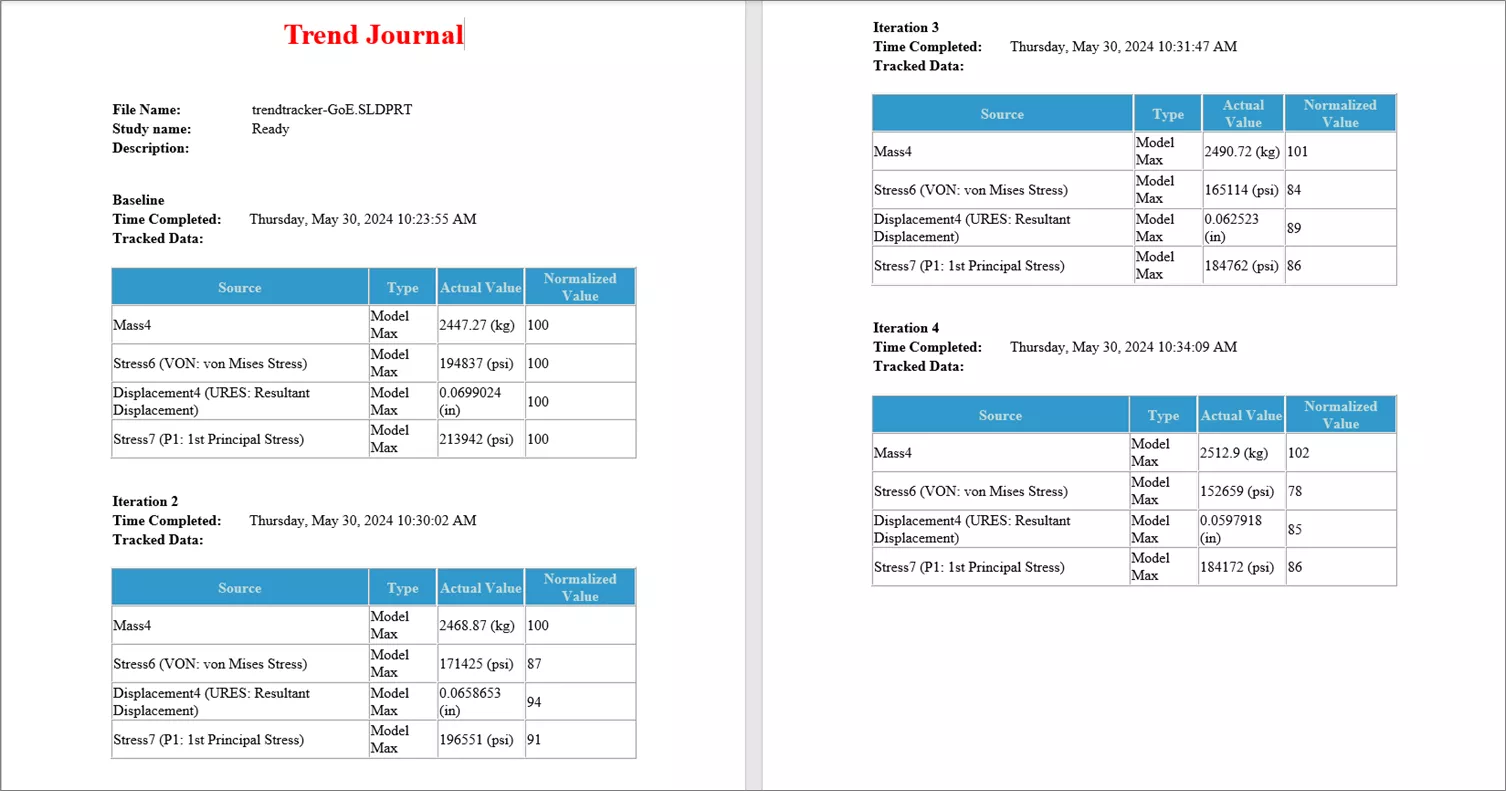
Figure 7: Trend Journal Results
SOLIDWORKS Simulation Professional
Simulation Features in SOLIDWORKS Simulation Professional:
- Resonant Frequency
- Buckling (Linear)
- Thermal Analysis
- Drop Test
- Event Based Motion
- 2D Simplification
- Pressure Vessel
- Materiality
- Submodel Study
- Optimization
- Topology
SOLIDWORKS Simulation Professional is the next level of simulation tools. Whether you need to determine resonant frequencies in your designs or require a good analysis tool for steady state and transient thermal studies, SOLIDWORKS Simulation Professional can fulfill both of those needs and more. You can also utilize the Optimization tool to identify the most optimal design to achieve your specific goal.
Why SOLIDWORKS Simulation Professional?
If your company needs to do more than linear FEA and fatigue studies, SOLIDWORKS Simulation Professional can help.
For example, in cases where part vibration due to resonance is a concern, it is best to design parts to resonate outside of certain frequency ranges. Simulation Professional allows you to run any number of Mode Shape plots to observe the Mode Shape movement at certain frequencies and will provide a list of frequencies and period values for each solved Mode Shape. (Figure 8)
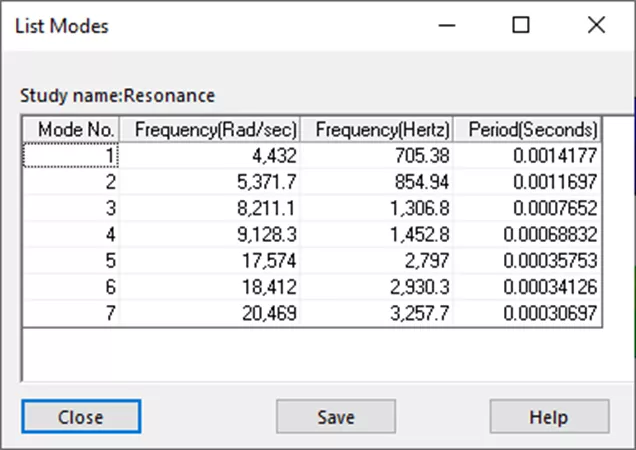
Figure 8: Mode Shape Plot and List of Resonance Frequencies
The Optimization tool in Simulation Professional can optimize a design to meet certain design criteria by iterating a range of variables automatically. Figures 9 and 10 below show the trunnion model again. To identify the most optimal design, we can define a goal (e.g., to minimize the total weight of our model) and define specific dimensions to vary over a range of values. The Optimization tool then iterates through a number of simulation studies, finding the combination that best accomplishes the design goals. (Figure 10). Think of the money and time saved in finding the best design quickly using the Optimization tool in Simulation Professional.
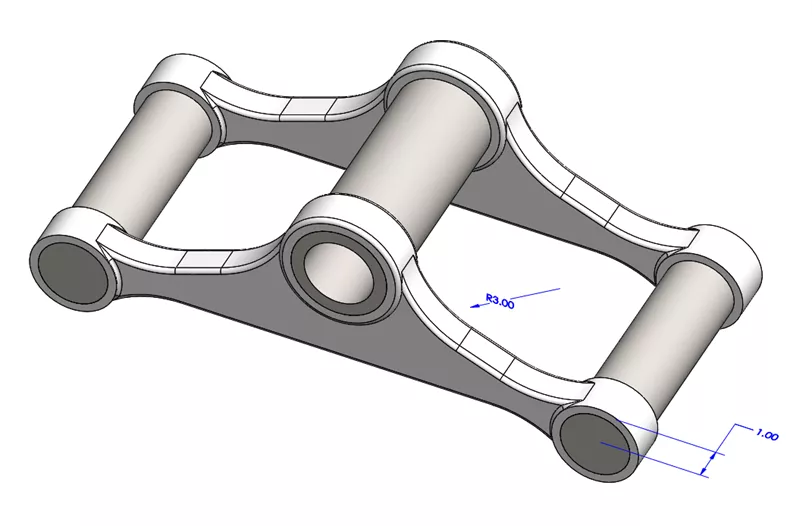
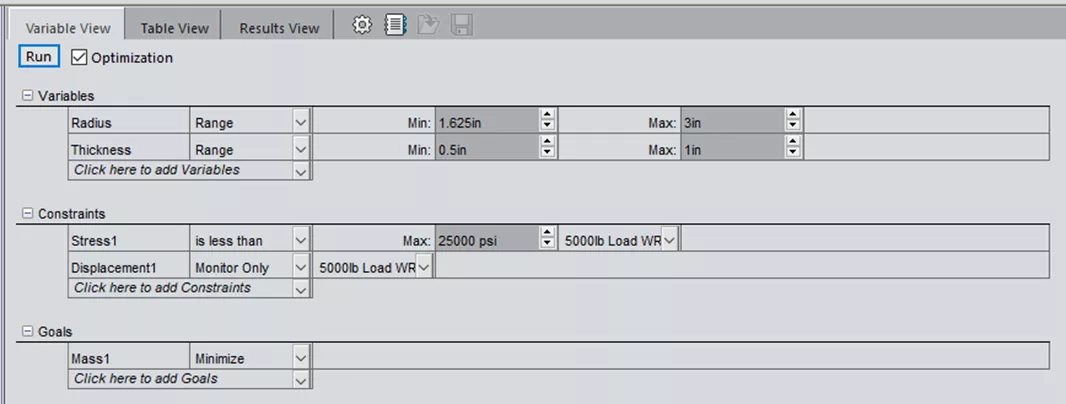
Figure 9: Model Dimensions to Range and Optimization Study Setup
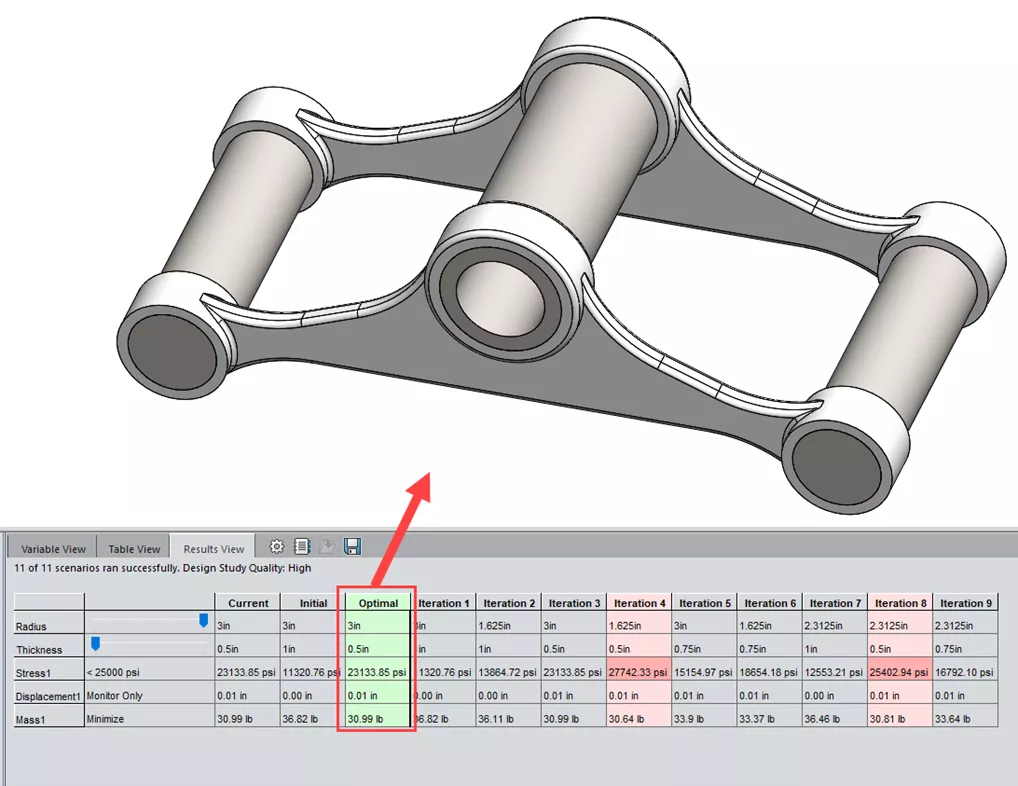
Figure 10: Model Changed to Most Optimal Design Result
SOLIDWORKS Simulation Premium
Simulation Features in SOLIDWORKS Simulation Premium:
- Nonlinear Static / Dynamics
- Harmonic Analysis
- Random Vibration Analysis
- Modal Time History Analysis
- Shock Response Spectra Analysis
- Composite
SOLIDWORKS Simulation Premium is the highest package level of simulation the SOLIDWORKS desktop application offers for FEA analysis. Simulation Premium provides everything in the other simulation packages plus Nonlinear Static analysis and Linear and Nonlinear Dynamic analysis. It also offers the ability to analyze shell element parts as a Composite laminate.
Why SOLIDWORKS Simulation Premium?
SOLIDWORKS Simulation Premium is ideal for companies that need to analyze nonlinear materials or materials in plasticity. An example of how Simulation Premium can handle nonlinear material analysis is demonstrated with a rubber CV boot (below). When creating a custom material, you can select specific material models to solve hyperplastic materials and input custom data for Simple, Tension, and Biaxial Planar Tension curves.
After running the analysis, you can observe the stresses, displacements, and strains on your models. (Figures 11 and 12) Additionally, you can let the solver output material constants from the analysis or input your known material constants to solve your nonlinear analysis.
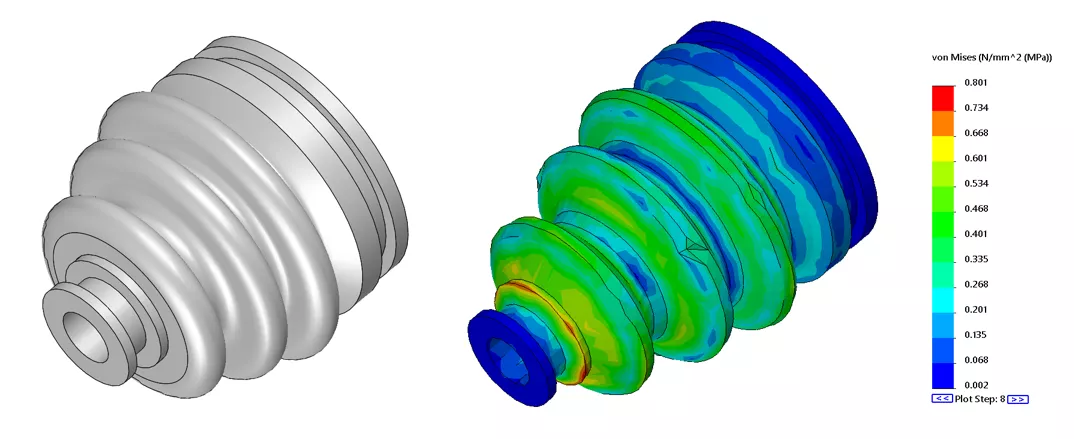
Figure 11: Model and Nonlinear von Mises Stress Result
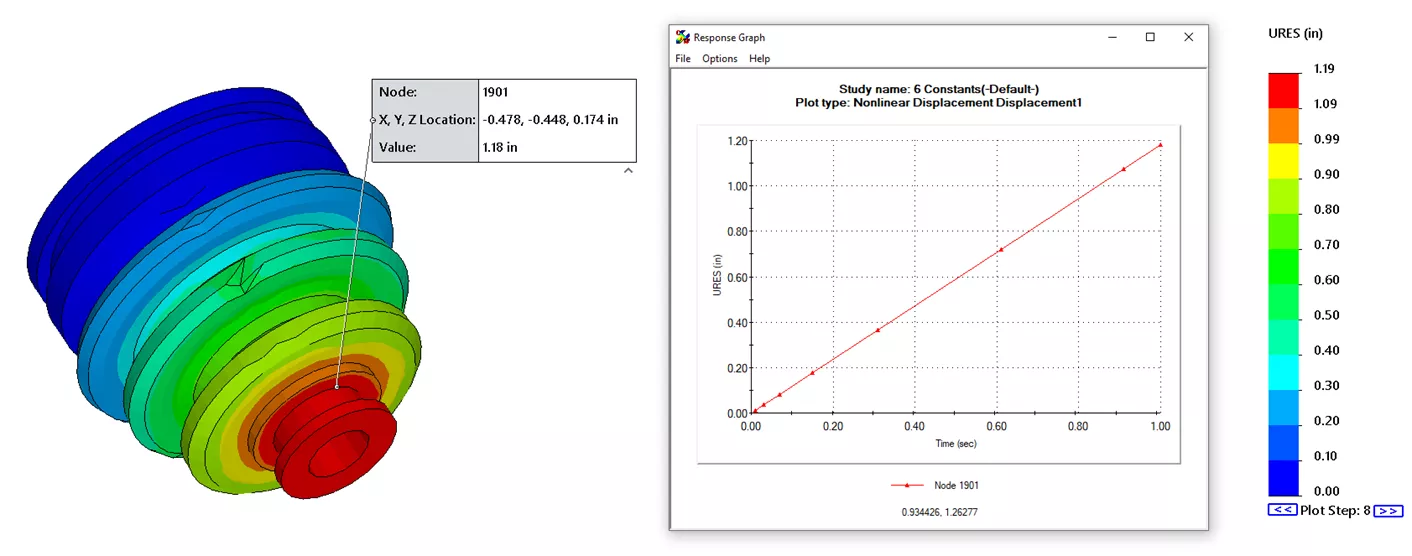
Figure 12: Probed location for Displacement Plot
If your company needs to analyze equipment that dynamically experiences shock, cyclic, random vibration, and peak response style loading, SOLIDWORKS Simulation Premium can help. It can handle output results in these conditions using Linear Dynamic methods such as Modal Time History, Harmonic, Random Vibration, and Response Spectra. It can also handle Nonlinear Dynamic analysis.
For example, if you build equipment that needs to support a running engine, such as the one in Figure 13, you can use SOLIDWORKS Premium to run a Harmonic analysis. You can also replace the running equipment with more advanced setup schemes like with the Remote Mass tool to shorten the analysis duration. As a result, you can determine the displacements at certain frequencies and graphically output the peak stress or peak frequency amplitude in specific directions. (Figures 14 and 15)
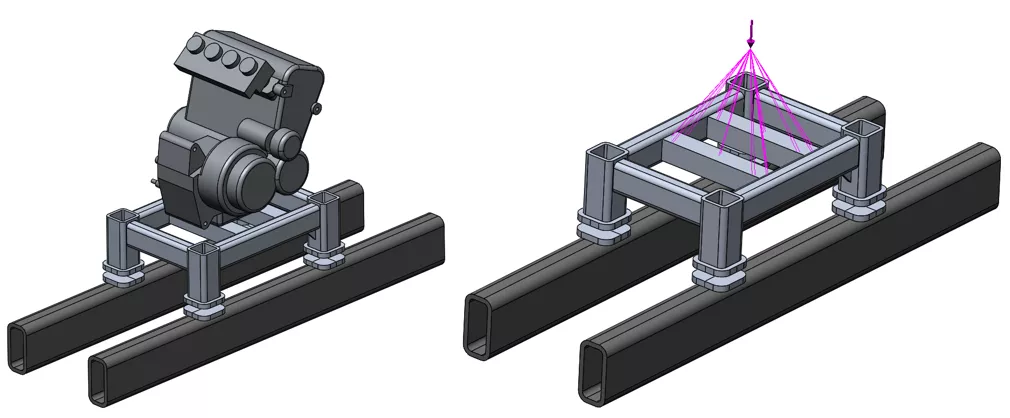
Figure 13: Model and Model with Remote Load Applied
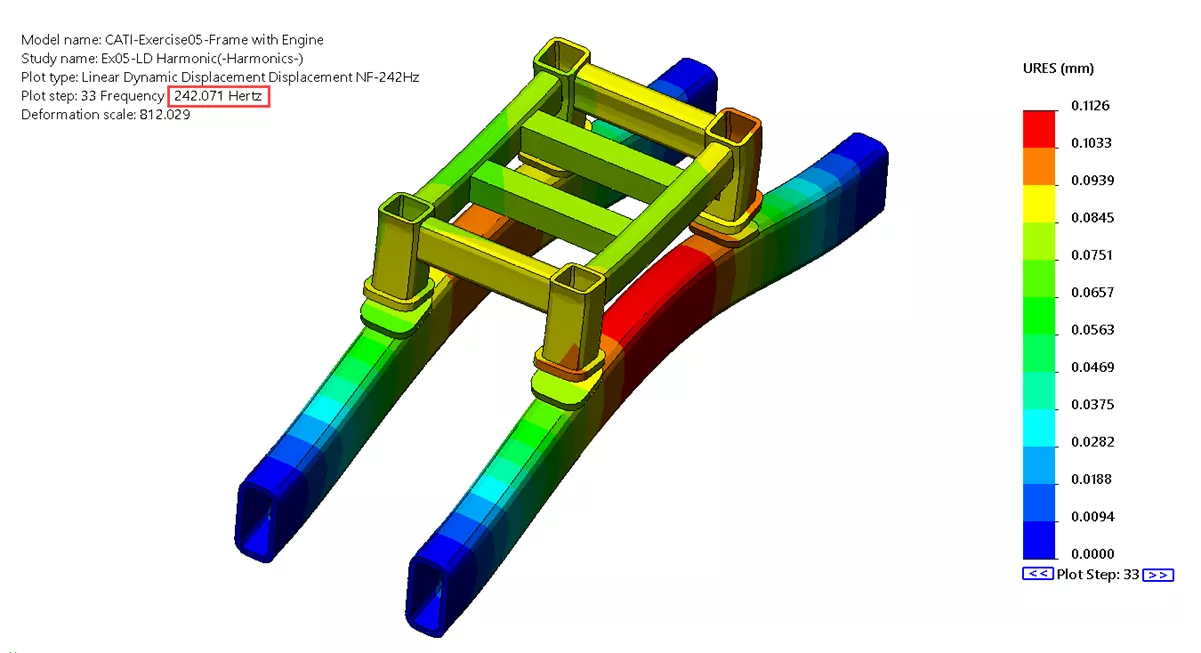
Figure 14: Displacement Plot at Certain Frequency
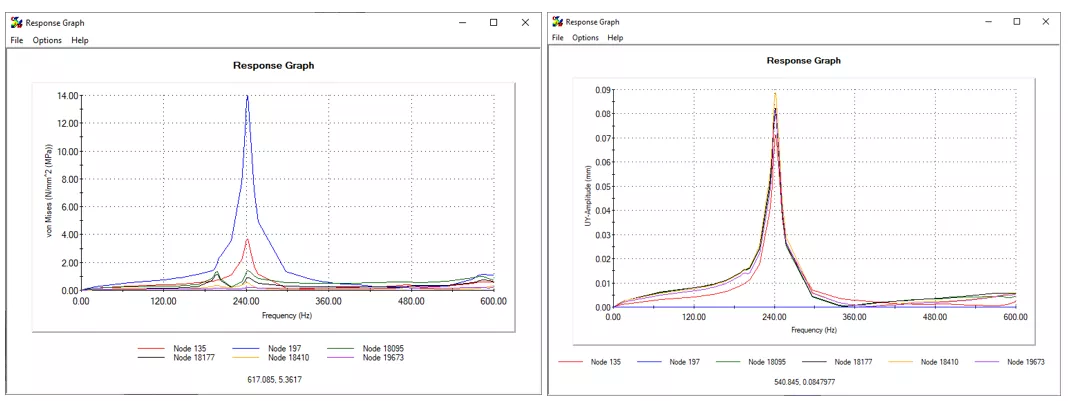
Figure 15: von Mises Stress and Amplitude Response Graph Plots
What SOLIDWORKS Simulation Package Makes Sense For You?
The capabilities of SOLIDWORKS Simulation will surprise you, so don’t be afraid to ask how we can help you with your Simulation needs. You may find a tool within the SOLIDWORKS Simulation suite of products that will take your company to the next level. Have questions about any of these Simulation packages? Please feel free to contact us.
Download the SOLIDWORKS Simulation Packages Comparison Matrix here.
Related Articles
Optimizing Your Workstation Budget for Design & Engineering Applications: Simulation
What is Topology Optimization - SOLIDWORKS Simulation
SOLIDWORKS Simulation Variable Amplitude Time History Fatigue Tool Tutorial
Rainflow Counting in SOLIDWORKS Simulation Explained
Winter Beehive Analysis Using SOLIDWORKS Flow & Thermal Simulation

About Nick Pusateri
Nick Pusateri is a Senior Simulation Specialist at GoEngineer. He has a Bachelor of Science degree in Mechanical Engineering from UMSL/Wash University of Missouri. Nick enjoys learning about different tools of SOLIDWORKS Simulation, Abaqus, and 3DEXPERIENCE SIMULIA.
Get our wide array of technical resources delivered right to your inbox.
Unsubscribe at any time.