SOLIDWORKS Simulation Nonlinear Material Models Stress-Strain Curves Explained
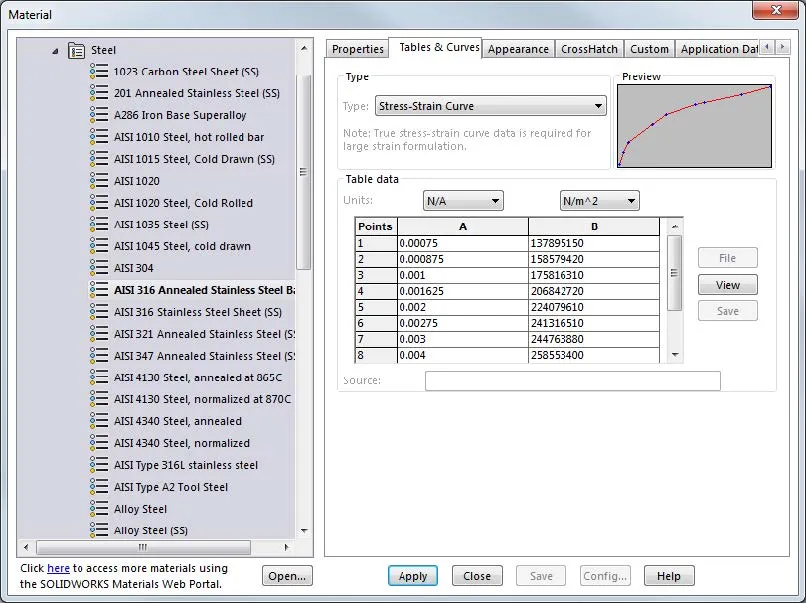
A Stress-Strain Curve in SOLIDWORKS Nonlinear Analysis is a graph of user-defined stress and strain data points that make a graph that the Nonlinear Analysis program can use to obtain a lot of useful information. Information like the yield point of the material (which should always be the very first point in any SOLIDWORKS Simulation Stress-Strain Curve), material strength, ductility, formability, elastic modulus, etc. In fact, only the Poisson’s ratio (NUXY) is taken from the Material dialog box once a Stress/Strain Curve has been defined for a material.
An example of a SOLIDWORKS Nonlinear analysis Stress-Strain Curve is shown below.

True stress/strain vs. Engineering stress/strain
Different types of stress and strains can be utilized when defining a Stress-Strain Curve these are defined below:
- Engineering Stress (or Nominal Stress) is where the applied load is divided by the original cross-sectional area of the material.
- True Stress (or Cauchy Stress) is where the applied load is divided by the actual cross-sectional area as it changes over time under the load.
- Engineering Strain (or nominal strain) is the finial length of a material under tensile force divided by the original length of the material before being placed under tensile stress. This type of strain is only accurate for small displacements (approximate percent length where this strain is still accurate is 5% displacement and lower).
- True Strain (or Logarithmic Strain) is the natural log of the quotient of current length over the original length. This type of strain is used when Engineering Strain no longer holds true in very large displacements.
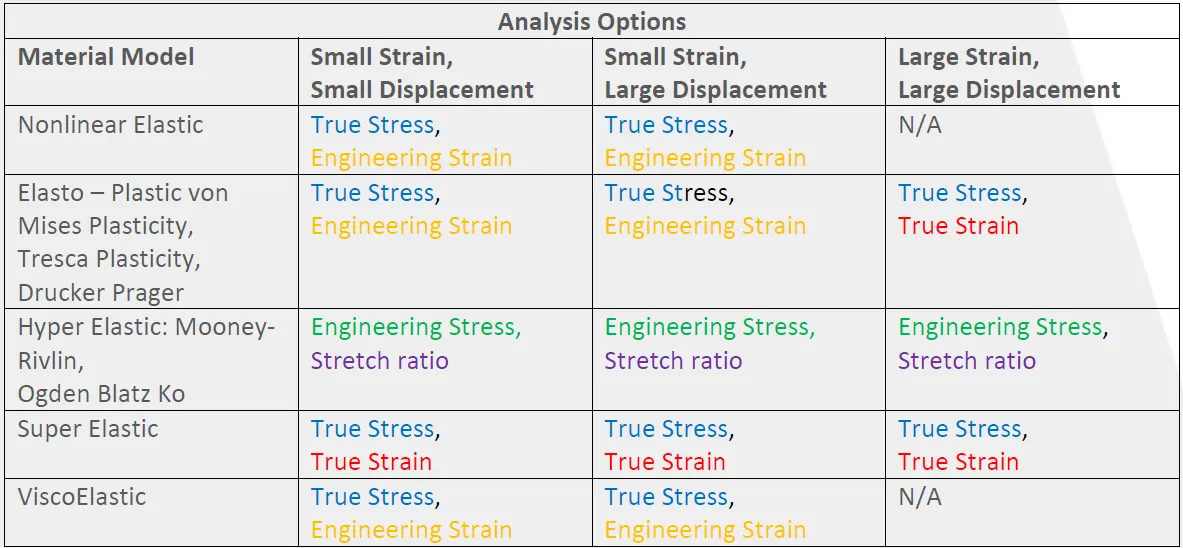
Now that these values have been defined the table below summarizes when each value should be used.

I hope you found this SOLIDWORKS Simulation article helpful. Check out the related tutorials listed below.
Learn more about SOLIDWORKS Simulation
Tips for Choosing a Solver in SOLIDWORKS Simulation
Using Thermal Boundary Conditions in SOLIDWORKS Simulation to Simulate a Press Fit Connection
SOLIDWORKS Simulation Results Export Options
SOLIDWORKS Simulation Gauss Points, Nodal, and Element Stress
Troubleshooting SOLIDWORKS Simulation No Penetration Contact Sets Recommendations

About Taran Packer
Taran is a SOLIDWORKS Simulation Technical Support Specialist at GoEngineer. He has a Bachelor’s degree in Biomedical Engineering from the University of Utah. Taran enjoys learning about different tools in SOLIDWORKS Simulation, Flow Simulation, and Plastics.
Get our wide array of technical resources delivered right to your inbox.
Unsubscribe at any time.