SOLIDWORKS Simulation Iso Clipping Tool: PropertyManager Walkthrough
Iso Clipping is a post-processing tool available in SOLIDWORKS Simulation. It allows us to modify the display of a result plot to cut away regions of the model above or below a certain value. It can also be used to show a range between two values and view surfaces of up to six specified values. Isolating areas of very high or low stress can be informative when investigating failures and optimizing designs.
To understand what options are available to us when using Iso Clipping, let's go through the PropertyManager, starting with the first section: Iso 1.
This article discusses the Iso Clipping tool in SOLIDWORKS Simulation. It goes through all the options available in the PropertyManager and how they work together to change the display of your study result plot.
Iso 1
To add Iso Clipping to a result plot, right-click it and select Iso Clipping...
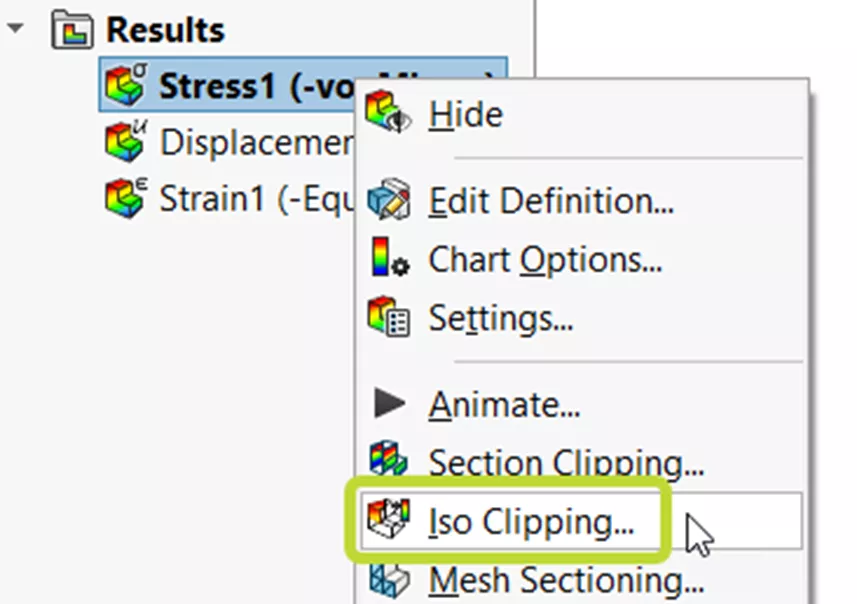
Figure 1: Iso Clipping option in Stress result plot right-click menu
Iso Clipping is only available for nodal stress plots. If the result plot is a vector plot or uses element values, Iso Clipping will not appear in the right-click menu. To see if a plot is using node values or element values, right-click it, select Edit definition, and expand Advanced Options.
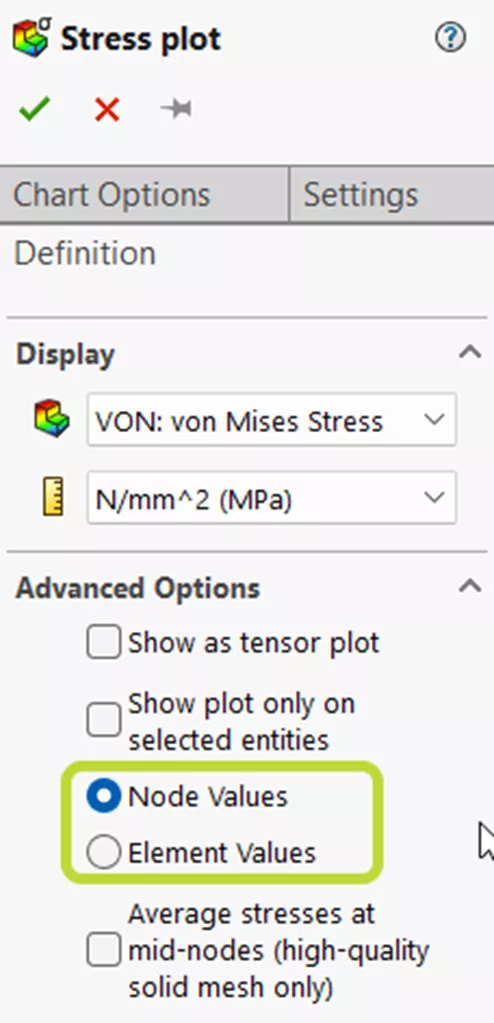
Figure 2: Node Values and Element Values radio buttons in Advanced Options
Iso 1 plots an iso surface in your model at the specified iso value.
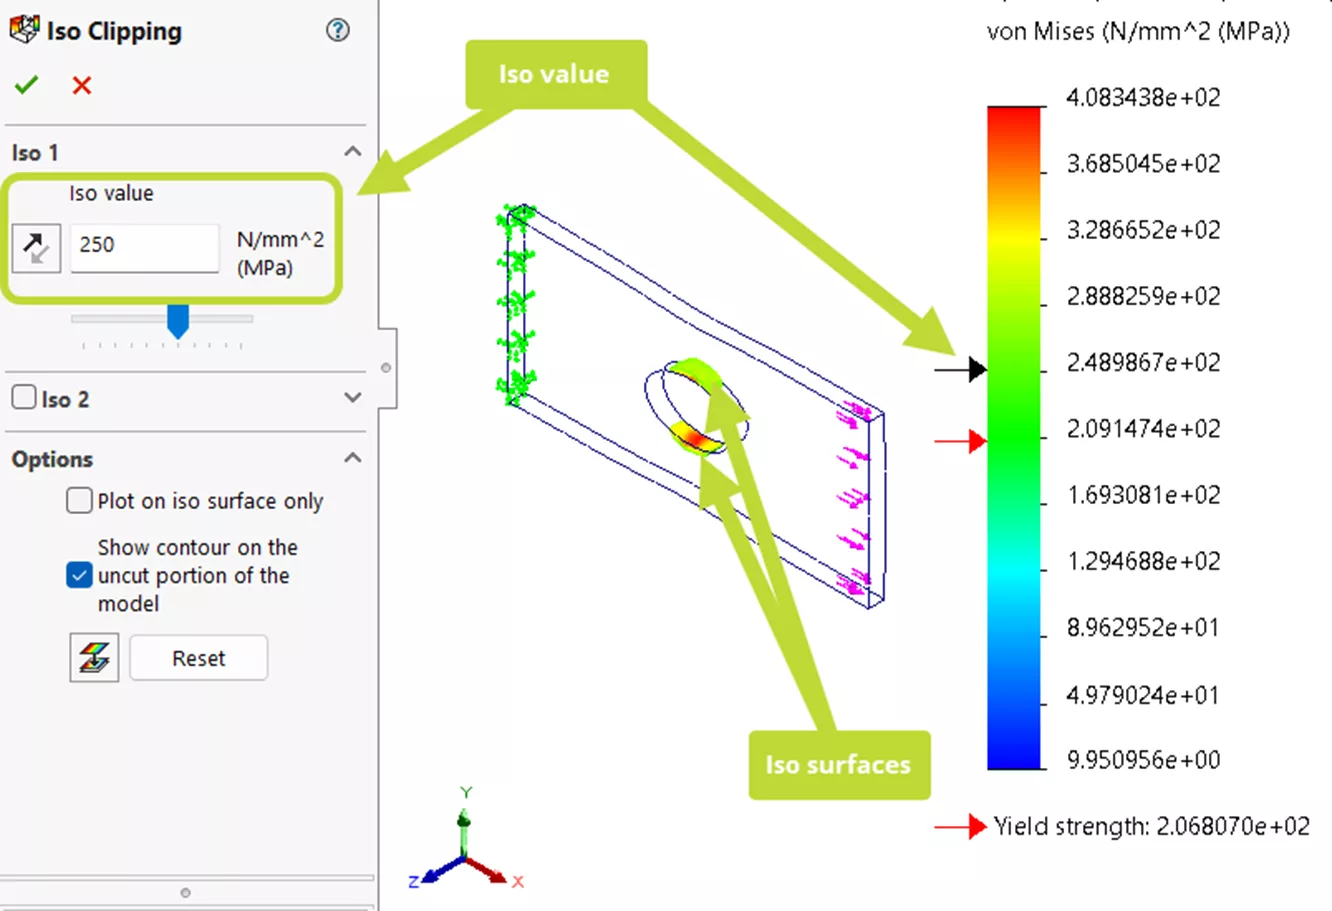
Figure 3: Stress result plot with Iso Clipping PropertyManager
In the example above, the Iso value is 250 MPa. A black arrow is added to the color chart at 250 MPa to indicate the iso value. Units in the Iso Clipping PropertyManager are determined by the result plot you're adding Iso Clipping to - if you want to change them, you'll have to edit the definition of the plot.
By default, Iso 1 is cutting material way from the model where the stress is less than 250 MPa. If you toggle the Reverse clipping direction button, the side of the model being clipped is flipped and Iso 1 will instead remove areas where the stress is greater than 250 MPa.
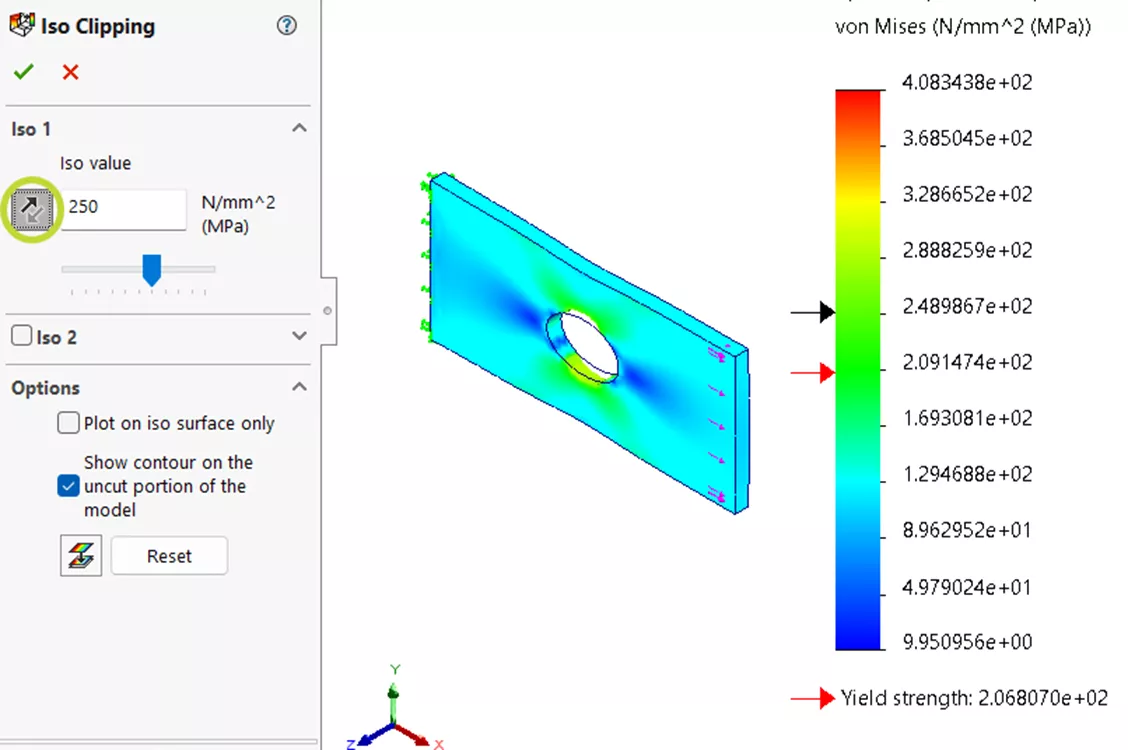
Figure 4: Stress result plot with Iso Clipping direction reversed
Iso 2
Below the Iso 1 section in the Iso Clipping PropertyManager, is a section called Iso 2 with a checkbox next to it. Checking that box adds a second iso surface with a second clipping condition.
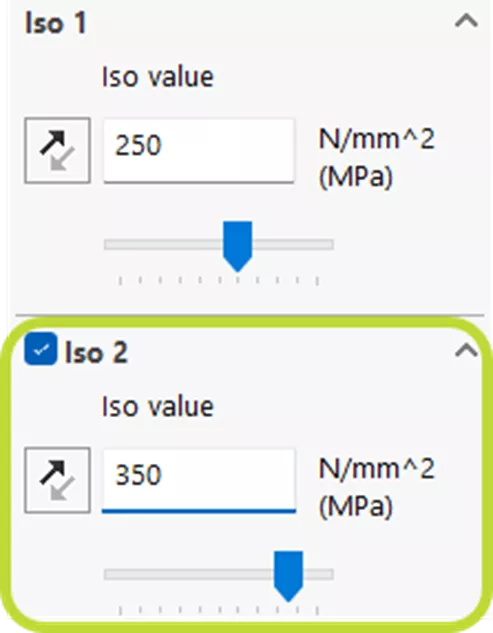
Figure 5: Iso 2 section of Iso Clipping PropertyManager
In this example, Iso 2's value is 350 MPa. Initially, the clipping will be set such that regions of the part with a stress less than 350 MPa are removed. This clips away the material between the two iso surfaces and displays only the iso surface at 250 MPa, the iso surface at 350 MPa, and the material that has a stress greater than 350 MPa.
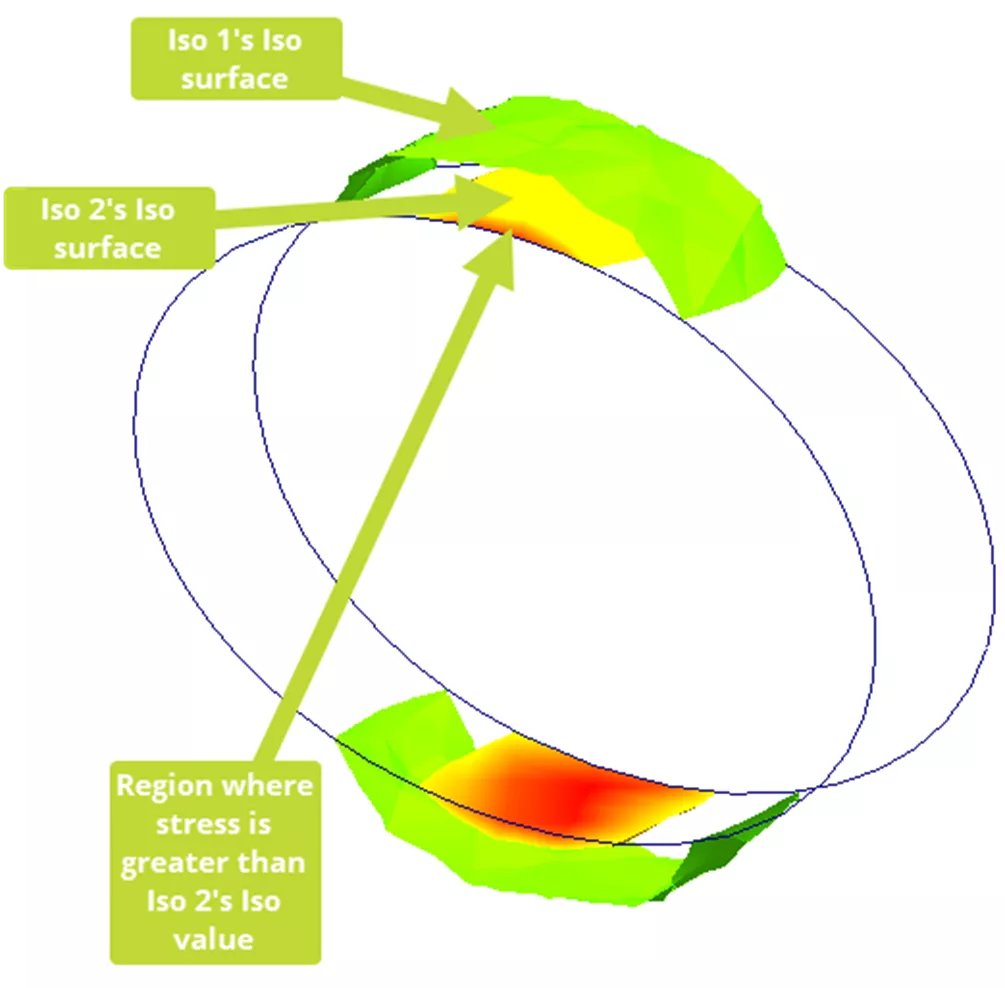
Figure 6: Iso 1 and Iso 2, clipping directions not reversed
Usually, if we add a second iso value, the goal is to show a range. To do this, we have to flip the direction of Iso 2. This changes the clipping parameters so that Iso 1 is removing stresses less than 250 MPa and Iso 2 is removing stresses greater than 350 MPa. This leaves us with a region between 250 MPa and 350 MPa.
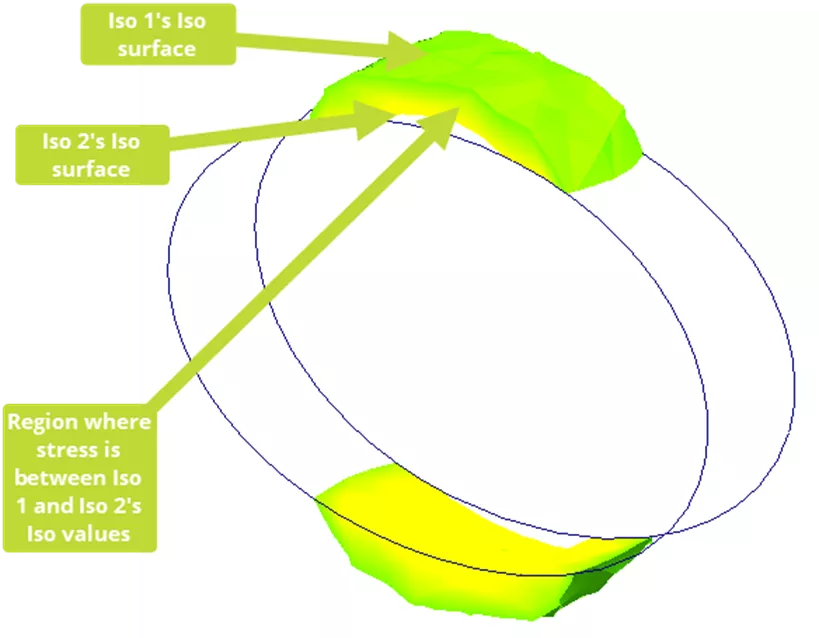
Figure 7: Iso 1 and Iso 2, Iso 2’s clipping direction reversed
Iso 3, 4, 5, and 6
When you check the box for Iso 2, an additional section titled Iso 3 appears. You can add up to six iso surfaces at six different iso values.
To illustrate what happens when you have more than two section views, we'll add two additional iso surfaces to the plot: Iso 3 and Iso 4.
Iso 3's isovalue is 190 MPa and Iso 4's isovalue is 170 MPa - both are less than Iso 1 and Iso 2.
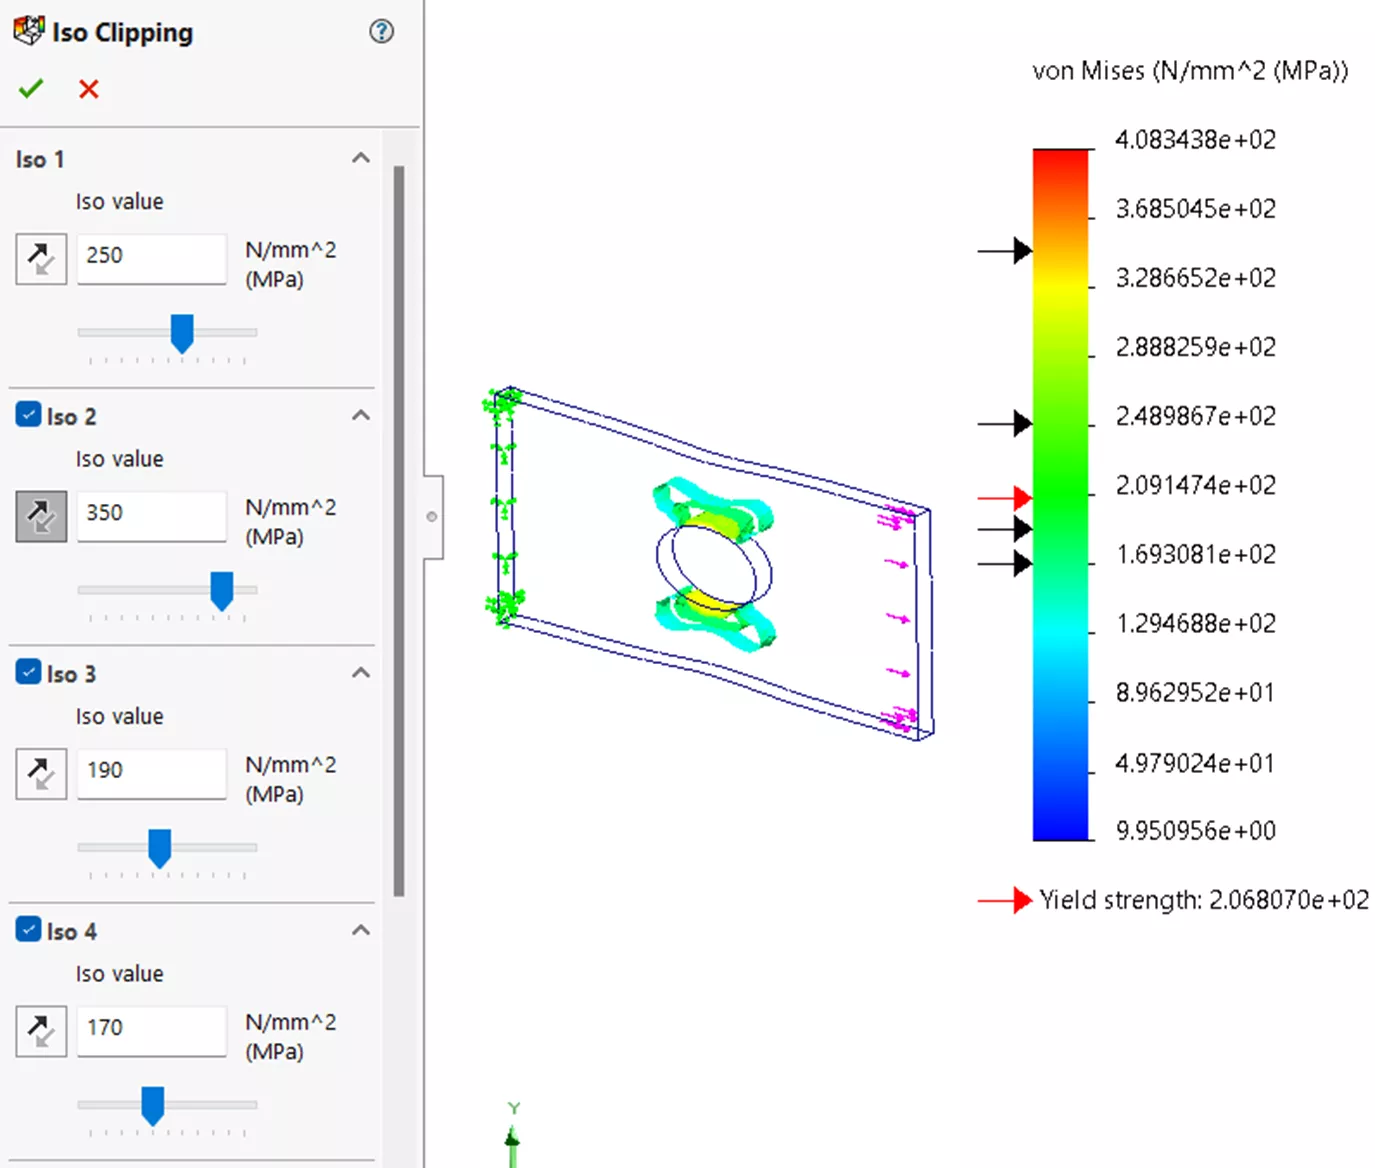
Figure 8: Stress result plot with four section views
Without reversing the clipping direction, both are automatically set to remove material that's less than 190 MPa and 170 MPa respectively. These additional clipping conditions are redundant - Iso 1 already removes regions where the stress is less than 250 MPa, which includes all regions where it's less than 190 Mpa and 170 Mpa.
As a result, what’s displayed when we add Iso 3 and Iso 4 are just the iso surfaces at the specified iso values (190 MPa and 170 MPa).
If you flip the direction on either Iso 3 or Iso 4, the model will disappear except for the four iso surfaces.
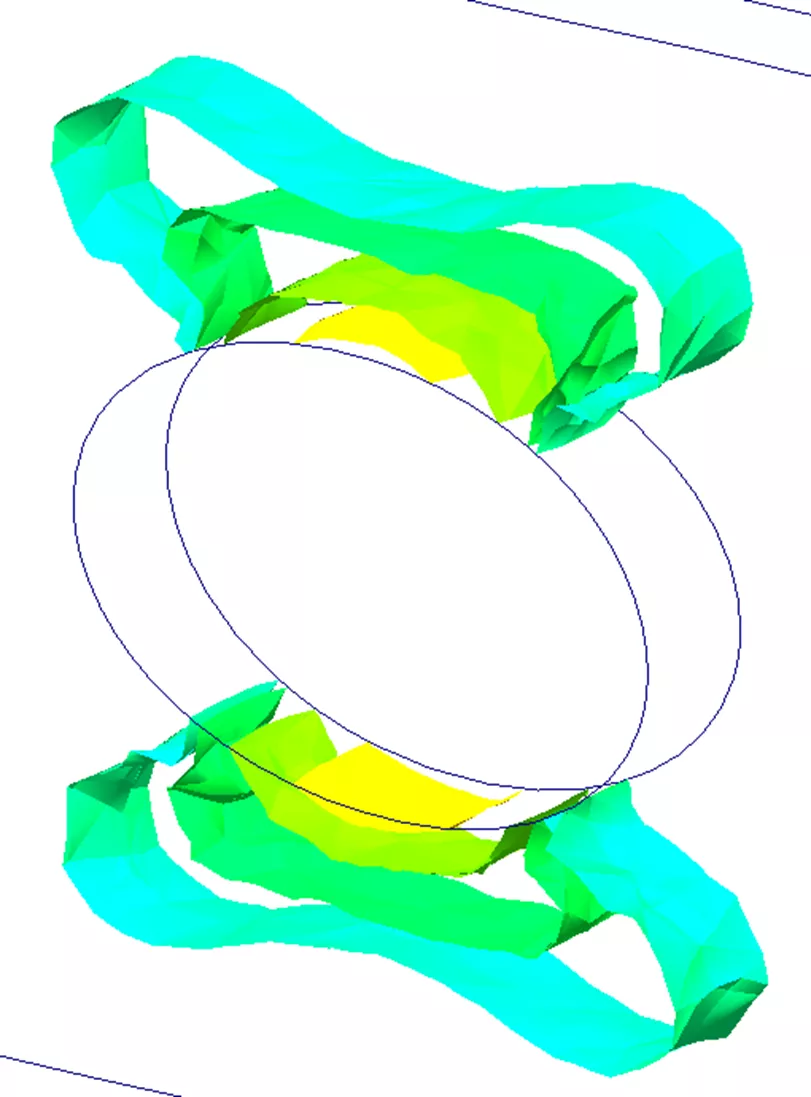
Figure 9: After reversing the clipping direction of Iso 3
This is because Iso 1 is removing stresses that are less than 250 Mpa and, in the example above, Iso 3 is removing stresses greater than 190 Mpa. Together, those two conditions account for the whole model.
Additional Options
To only show the iso surfaces (not any of the model), go to the Options section at the bottom of the PropertyManager and check the box for Plot on iso surface only.
The other checkbox in the Options section is for Show contour on the uncut portion of the model. Turning this option off hides the results on the parts of the model that are not removed by Iso Clipping. Only the iso surfaces will be displayed in a color determined by the color chart.
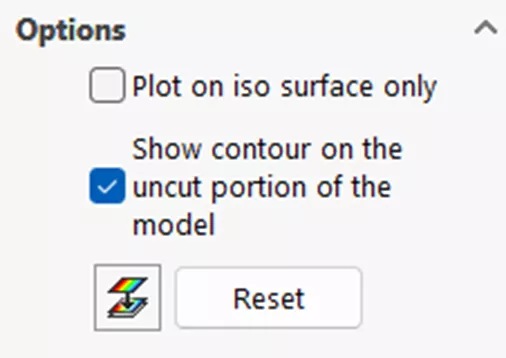
Figure 10: Options section of PropertyManager
Volume (Element/Geometric)
If you've only specified a value for Iso 1, you may have noticed that an additional line reading Volume (Element/Geometric) = XX.XX%/YY.YY% was added to the plot legend. Both percentages represent how much of the model is shown in the plot with Iso Clipping enabled.
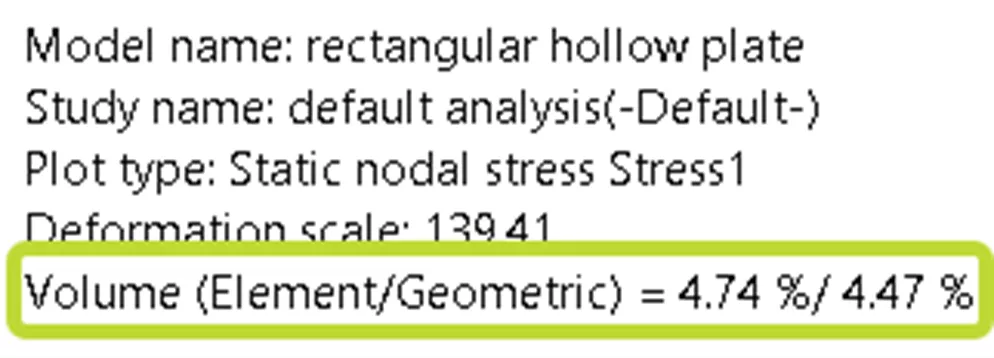
Figure 11: Plot Legend
The first percentage is the number of elements shown vs the total number in the model.
The second is the volume of elements shown vs the total volume of the elements in the model.
These values will potentially be different if your mesh varies widely in size. If the element size is more uniform, they should be similar.
How to Turn Off Iso Clipping
When you click the green check at the top of the Iso Clipping PropertyManager to exit it, Iso Clipping remains active. To disable it, right-click the result plot and select Iso Clipping again. At the very bottom of the PropertManager is a button that toggles Clipping on and off.

Figure 12: Clipping on/off button
You can also clear all the changes you made to Iso 1 (and Iso 2, Iso 3, Iso 4, etc.) by clicking on the Reset button.
I hope you found this SOLIDWORKS Simulation explaining all the options available in the Iso Clipping PropertyManger helpful. Check out more SOLIDWORKS Simulation tips and tricks listed below. Additionally, join the GoEngineer Community to participate in the conversation, create forum posts, and answer questions from other SOLIDWORKS users.
More SOLIDWORKS Simulation Tutorials
SOLIDWORKS Simulation CAD Conditioning with Shell Elements
Importing .CSV Files into SOLIDWORKS Simulation Design Studies
How to Use the SOLIDWORKS Simulation Probe Tool
SOLIDWORKS Simulation vs Abaqus: When Should You Upgrade?
SOLIDWORKS Simulation Mesh Convergence in Frequency Analysis

About Lauren McGarry
Lauren McGarry is a Certified SOLIDWORKS Expert based out of San Diego, California. She earned her Bachelor of Science degree from Case Western Reserve University and has been with GoEngineer as a Technical Support Engineer since 2016.
Get our wide array of technical resources delivered right to your inbox.
Unsubscribe at any time.