SOLIDWORKS Flow Simulation Transient Pressure Pulse Study
In this guide, we review how SOLIDWORKS Flow Simulation can simulate the transient pressure pulse on a design where a fluid is allowed to enter and exit at different intervals. By setting up this study, we’ll review the time-dependent functionality where we can control the different areas of the fluid travel through a system caused by a pressure drop.
The definition of a pressure pulse comes from fluid dynamics where the motion of fluid is periodically moving at different intervals through the system. Consider an intake manifold where the opening and closing of the ports which allow the fluid to exist at different stages. By using SOLIDWORKS Flow Simulation, we can recreate this phenomenon with data that closely matches the real-world effects.
Data
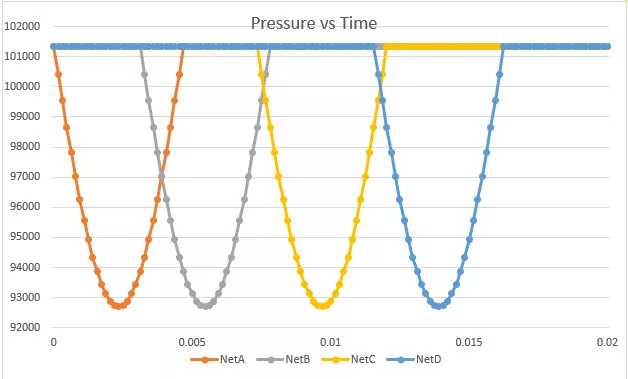
To begin, we’ll need some form of data to control how the opening and closing of these ports affect fluid flow. In this example, we’ve created a pressure drop graph that simulates the progression of the fluid that follows a parabolic curve.
The ambient value of 101625 Pa represents pressure equal to atmospheric to where the pressure drop is equal to zero. The maximum drop will be represented by the lowest pressure recorded (negative due to fluid leaving the system).
In the data, we’ve added three additional curves at different intervals to represent the additional outlets and when the lids will stay opened and then shut.
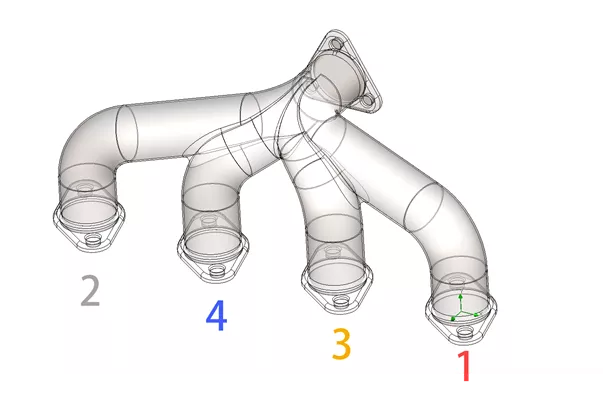
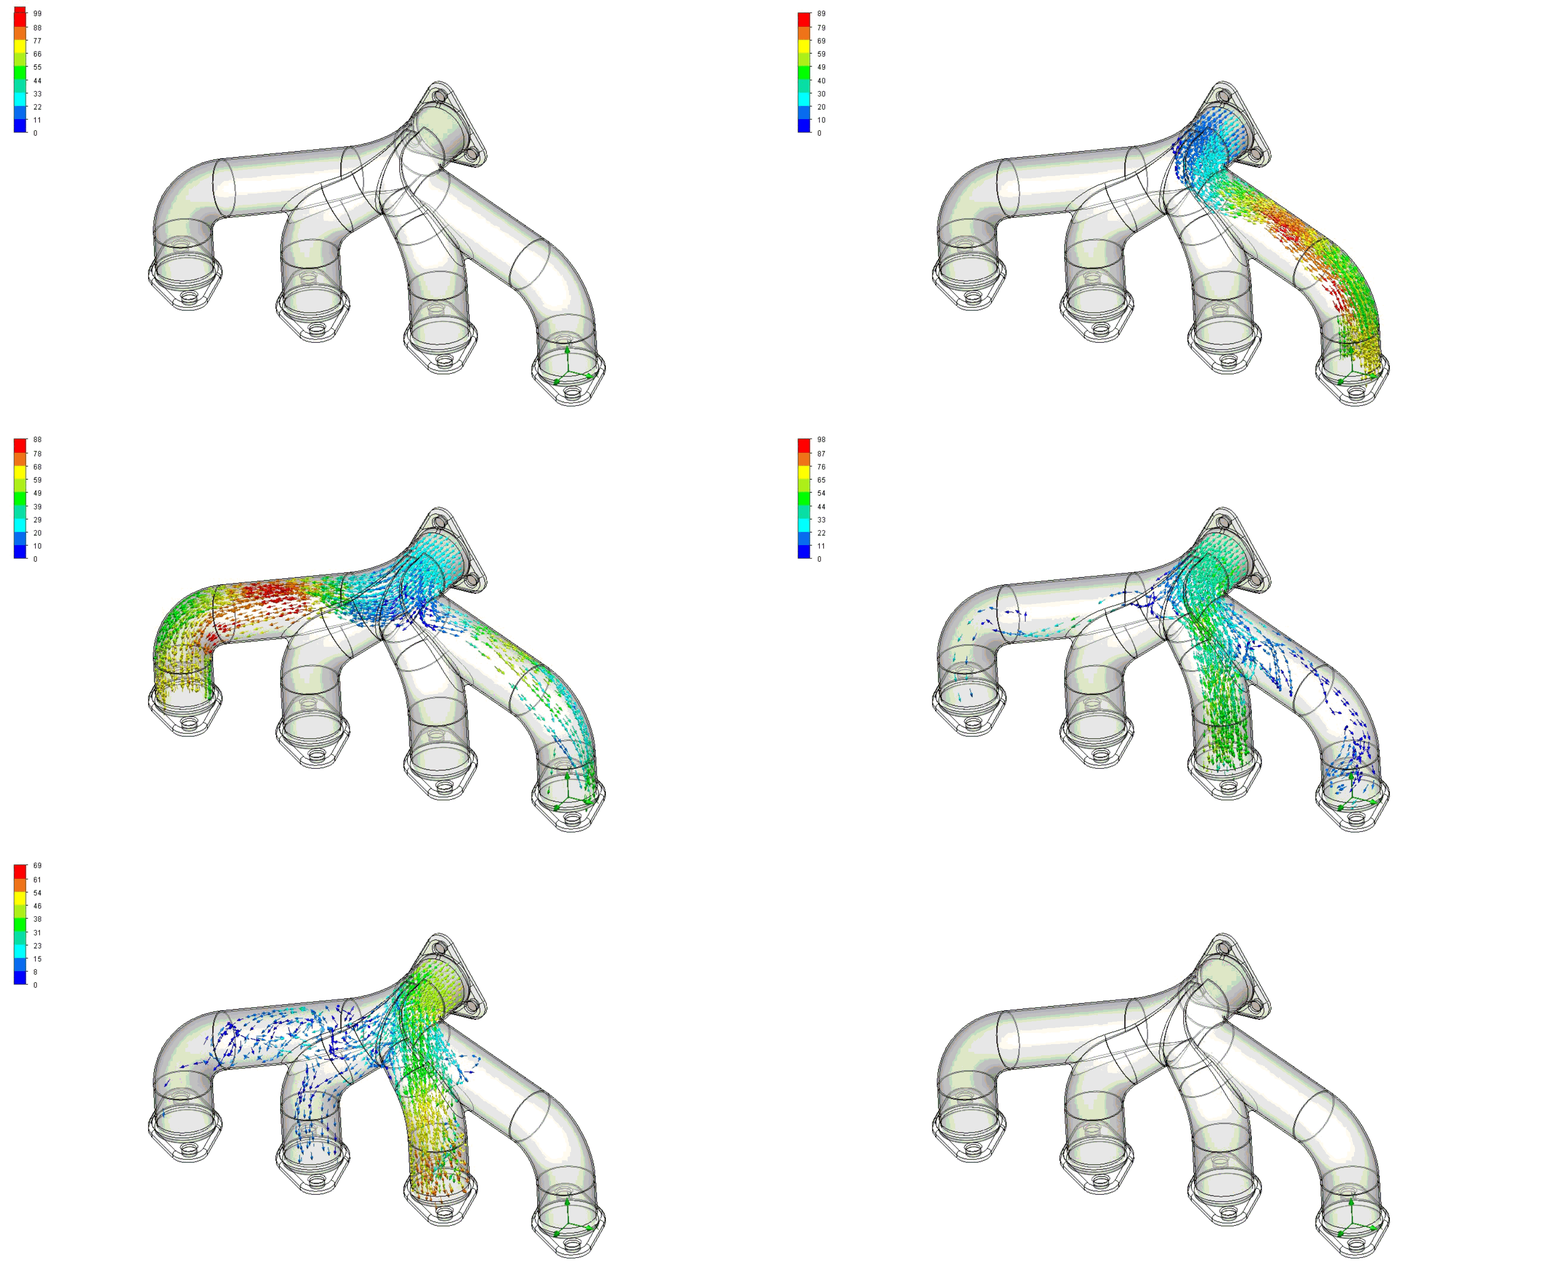
In SOLIDWORKS, we’ll perform this on an intake manifold that contains four tubes. The firing order will follow what is shown below.
Creating a New Flow Simulation Project
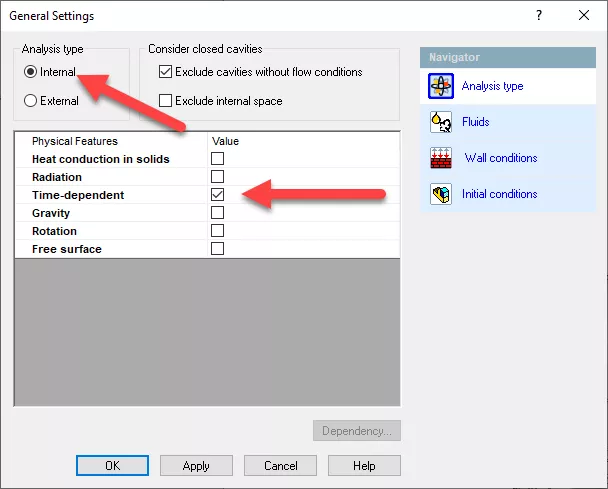
In the General Settings of the flow setup, we’ll set up the study to be Internal and we’ll also enable the Time-dependent checkbox which will allow us to specify the pressure values as different intervals.
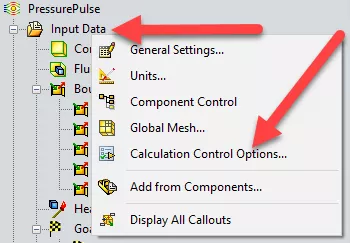
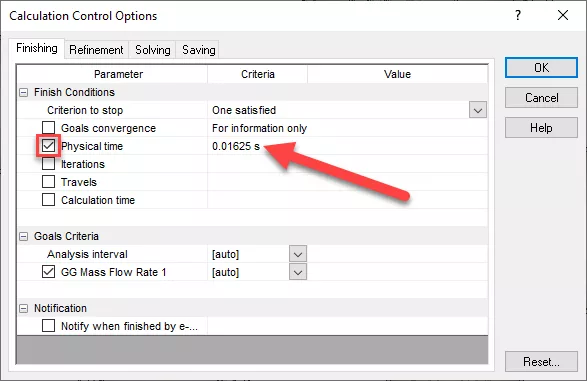
To define the physical time, mouse over the top of the tree and RMB Input Data > Calculation Control Options. Enable the physical time and enter a value that represents where we want the end of the cycle to be.
To set up the boundary conditions, we'll define the inlet to have an environment pressure equal to ambient (101625 Pa). For the rest of the lids, we’ll need to edit the definition and select the dependency option to set up a table.
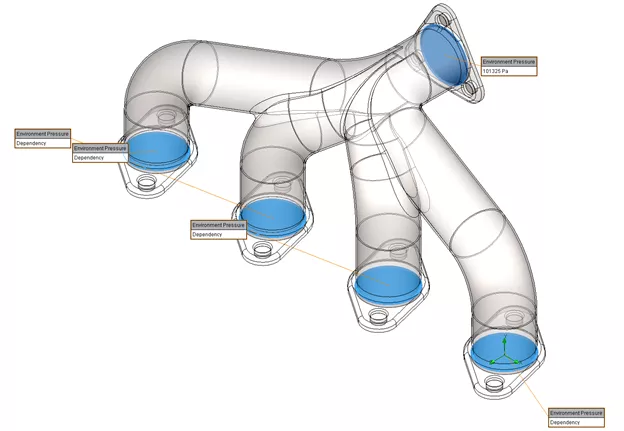
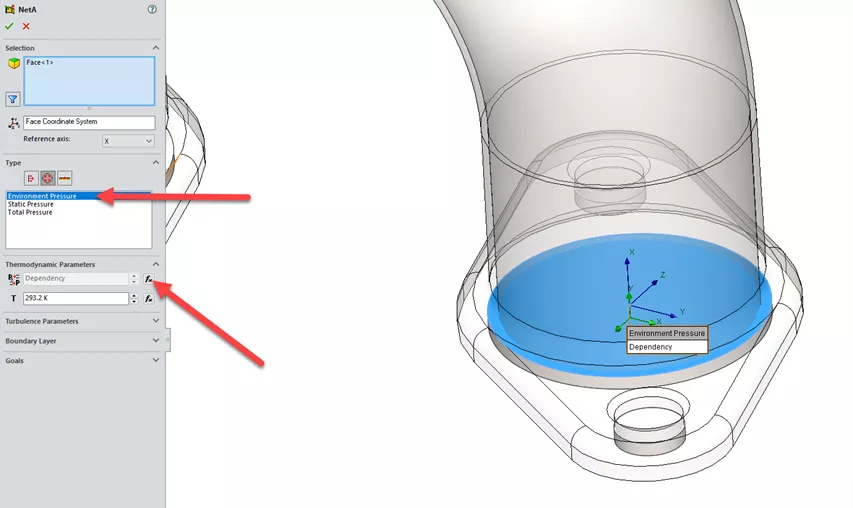
When the Dependency window appears, copy and paste the data from the Excel spreadsheet (CTRL+C and CTRL+V). For dependency type, it’ll be important to switch it to F(time) to which the values correspond to the correct columns.
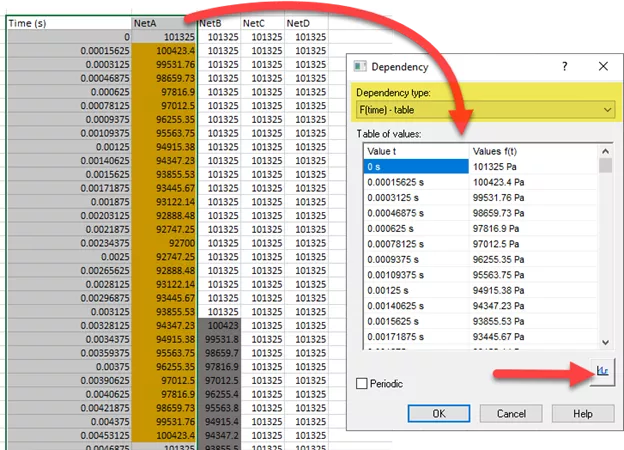
To verify that the values are copied correctly, use the Preview button to view the curve.
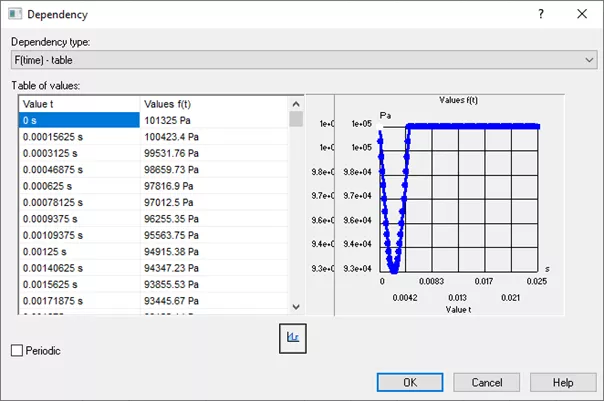
This process is repeated for the rest of the lids that match the firing order.
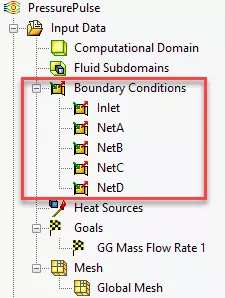
The setup will end up having a total of five Boundary Conditions.
Results
Once the study is complete, we can use SOLIDWORKS Flow Simulation to obtain the results for pressure pulse occurring inside the intake manifold.
In this example, creating an animation of the flow trajectory is a great way to reveal the full physical time duration from start to finish.
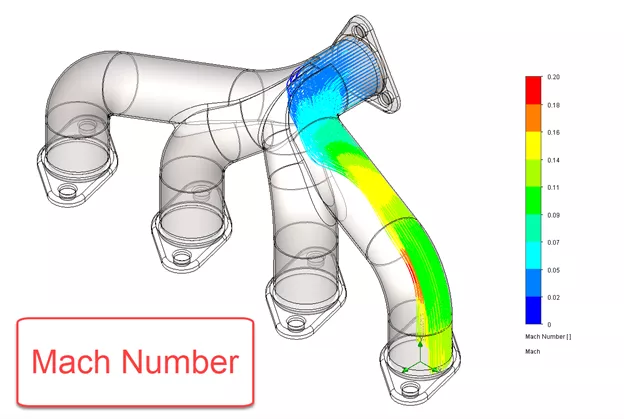
We can also create a flow trajectory plot to show the speed as well as a surface pressure plot to reveal the pressure at a specific time interval.
I hope you found this SOLIDWORKS Flow Simulation transient pressure pulse study interesting. Check out more Flow Simulation tutorials below.
More SOLIDWORKS Flow Simulation Tutorials
SOLIDWORKS Flow Simulation Fluid Mixing Tutorial
Understanding the Tesla Valve Using SOLIDWORKS Flow Simulation
Customizing SOLIDWORKS Flow Simulation Feature Tree Categories
Different Pressures in SOLIDWORKS Flow Simulation

About Jackie Yip
Jackie Yip is a Technical Support Engineer at GoEngineer. When Jackie isn’t assisting customers or teaching a SOLIDWORKS Essentials class, he enjoys road biking and keeping up on the latest tech trends.
Get our wide array of technical resources delivered right to your inbox.
Unsubscribe at any time.