SOLIDWORKS Flow Simulation Design of Experiments and Optimization Study
Once an initial Flow project has been completed in SOLIDWORKS Flow Simulation, there is an additional tool we can use to optimize our goals. This is a Parametric Study called Design of Experiments and Optimization.
The Design of Experiments and Optimization study allows us to optimize our design with multiple input variables. The input variables can be either simulation parameters or geometry from the model. We can select minimizing, maximizing, or matching a value of a goal or a summation of goals for the target optimization. Also, different weighting factors can be set for each goal that will consider how important each goal is for the wanted objective function.
Optimization Example
For this example, we have a racer wing with both down force and drag force. We'll start by taking a look at the average value for the goals we have set for our initial run of the project.
To do this, right-click on the Goal Plot and select Edit Definition then Show. For the initial run, we can see that the average value for each of the goals is:
| Down Force (-Y) | -540.614 N |
| Drag Force (-Z) | -246.489 N |
Starting a Design of Experiments and Optimization Study
To start the Design of Experiments and Optimization study, right-click on the study name from the Projects and select New Parametric Study. This will bring up a window at the bottom of your screen.
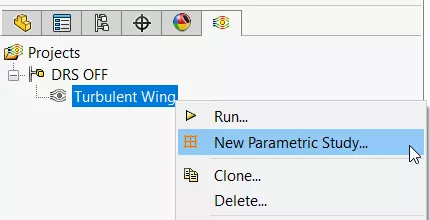
In the drop-down list, select Design of Experiments and Optimization.

Selecting Input Variables
Next, we can start adding Input Variables. Click the Add Dimension Parameter icon.
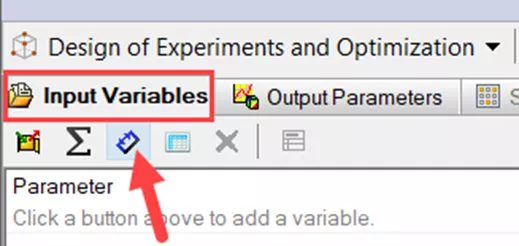
From here, switch to the FeatureManager Design Tree and double-click on the feature that has the wanted dimension. This will activate the dimensions in the feature so we can select the one we want.
In this example, we will double-click the Move Face1 feature from the tree, select the 57º dimension, and then accept the variable with the green check.
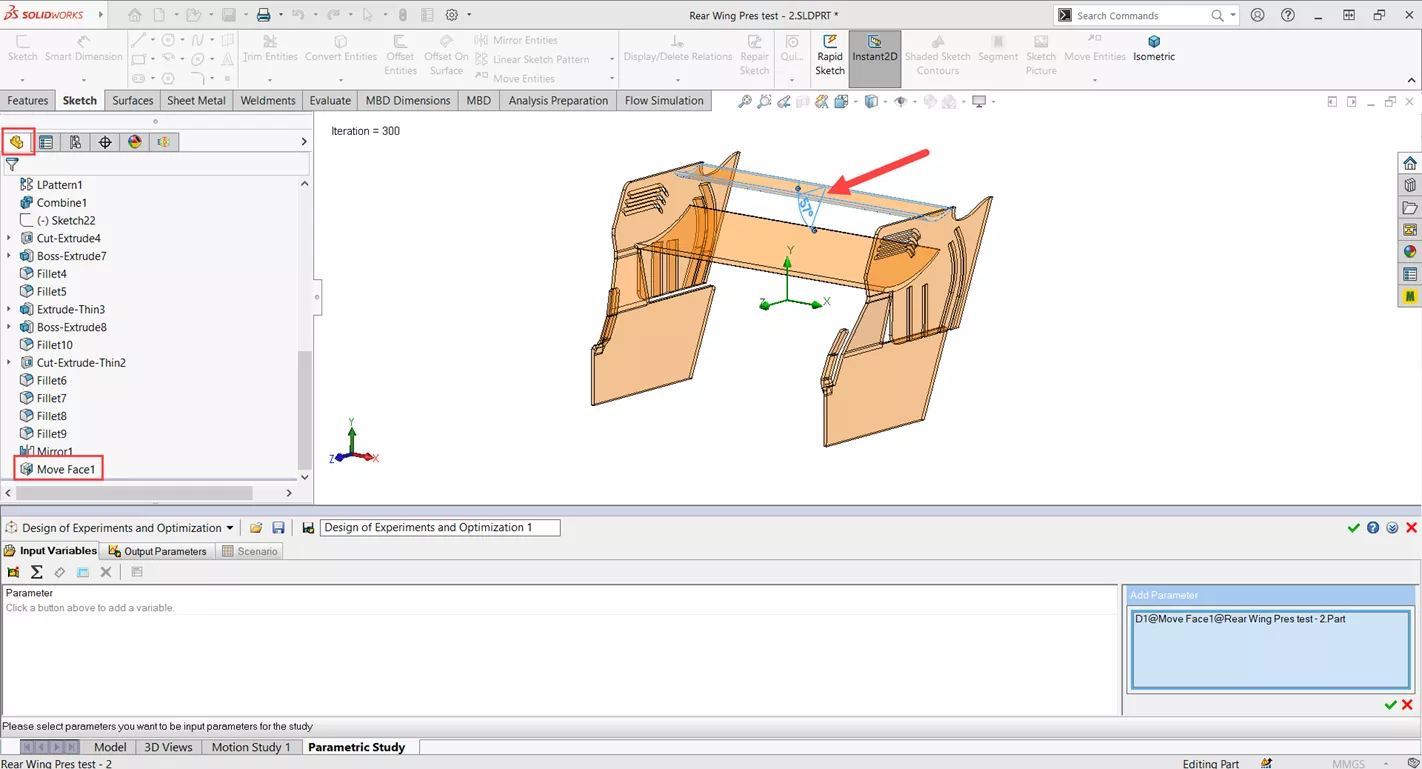
Now we can change the range of values to 0º < Value < 57º by double-clicking on the values automatically listed.

Setting Goals for Output Parameters
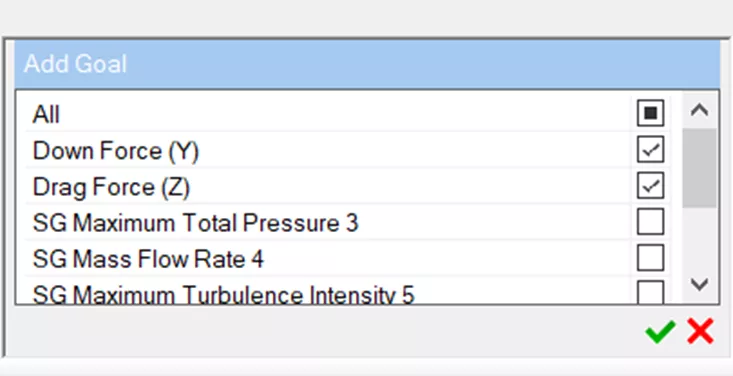
To add goals for the Output Parameters, click the Add Goal icon and select the wanted goals.
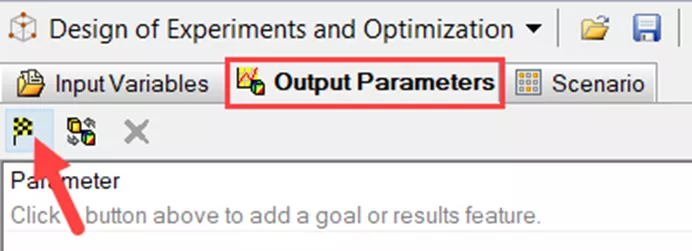
In this example, we want to include both of the main goals, so we will select Down Force (Y) and Drag Force (Z).
Creating Scenarios
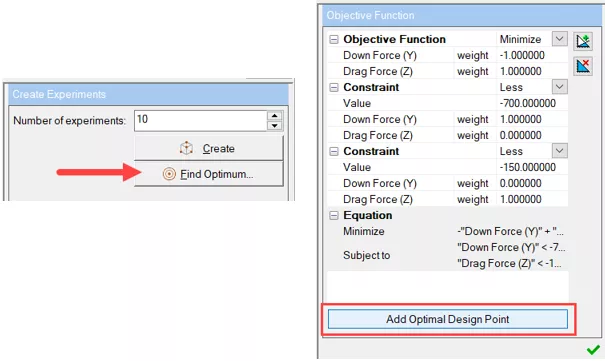
On the Scenario tab, choose Find Optimum.

For the Objective Function, we have the options of Minimize, Maximize, or Target. This option chooses how we are going to be approaching our optimized number.
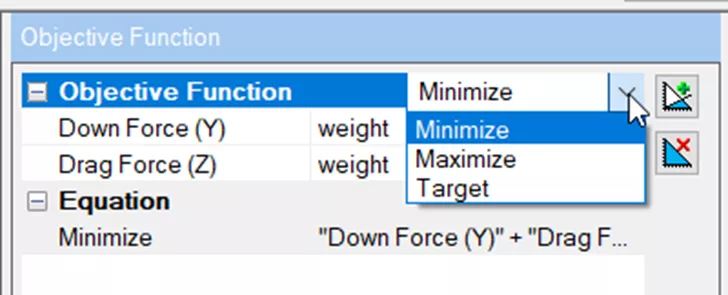
With this example, we will use Minimize and add a couple of constraints by selecting the Add Constraint icon.
![]()
To make the Down Force (-Y) value approach the maximum value, we will add a minus sign (–) in front of the number 1.000, but we will keep the Drag Force at 1.000 because we want to still approach the minimum value. What this is saying is whatever value we are going to specify for the target value in the constraints, find the maximum value for the Down Force and the minimum value for the Drag Force around that target value.
For the first constraint, we will select Less and choose the value of -700 N.
This will be for the Down Force, so we will set the Down Force (-Y) weight value to be 1.000 and leave the Drag Force (-Z) at 0.000. In a similar fashion, we will set the second constraint for the Drag Force value for Less at -150 N.
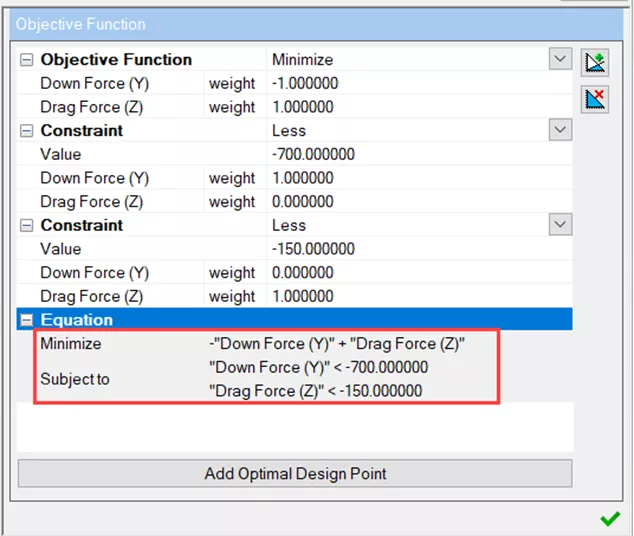
Once those parameters are in place, we can see the equation. The equation states that our negative Down Force is going to be maximized, we are looking for a value less than -700, our Drag Force will be minimized, and we are looking for a value of less than -150. Keep in mind we will see values above each of these after running.
After selecting the green check mark for the Objective Function settings, we will choose how many scenarios we want there to be. This will create different values for our input variables within the range we had set. So for our example, for Number of experiments, we'll choose to have 10 and select Create.
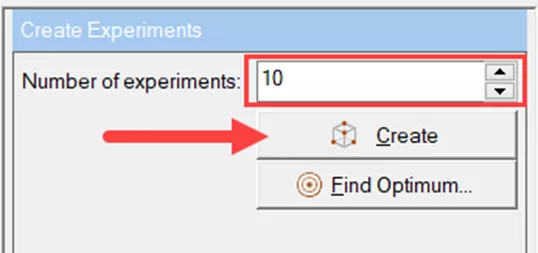
This will create 10 different scenarios with differences between 0º and 57º for the input variable of the angle of the top wing. Now we can run the study.

Finding the Optimal Design Point
Once all of the experiments are done solving, we can take a look at what the optimal design point is. To do that, select the Find Optimum option and select Add Optimal Design Point.
This will add a column in front of the experiments and will list the optimum values for the input and show how close we were able to get for each of the target values. As you can see, the results are the closest to Experiment 9.

Now we will be able to run just the Optimum study to see if they are indeed going to be good values. To do so, just select Optimum 1 so the whole column highlights in blue, then select Run.
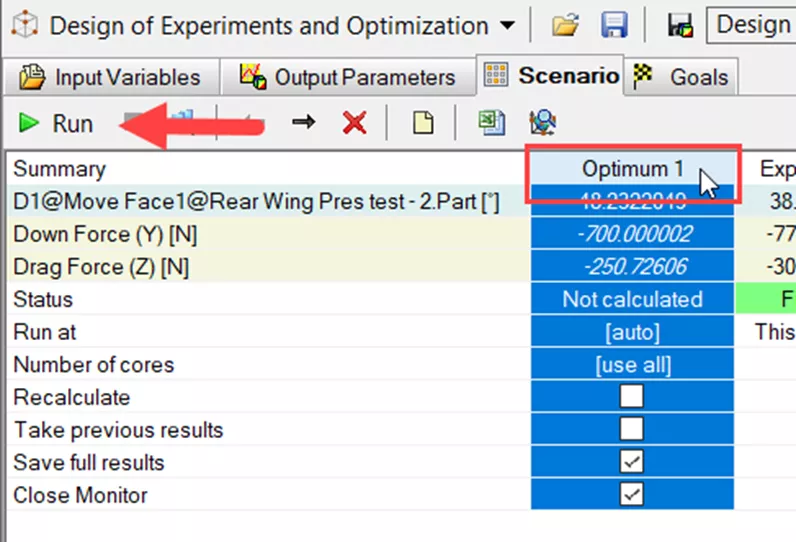
The values have changed a little bit.
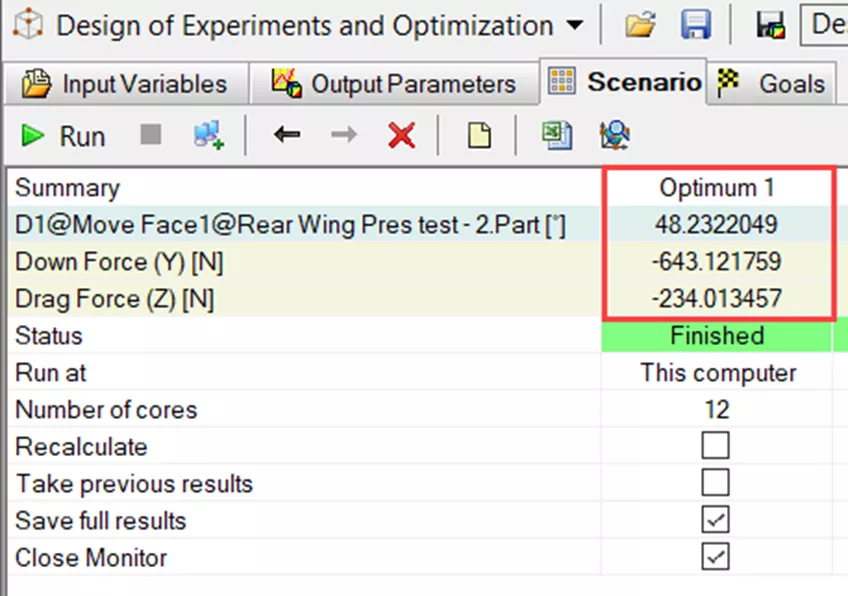
The Down Force (-Y) value is less than -700 N; however, the Drag Force (-Z) is not less than -150 N as we had specified in the Objective Function.
The SOLIDWORKS design engine ideally will try to meet all the constraints listed; however, isn’t always able to find exactly what is set, and if that is the case, it will find the value that is closest.
Check out our YouTube video that explains more best practices when using Design of Experiments and Optimization studies in SOLIDWORKS Flow Simulation.
Want to become an expert?
Take the official SOLIDWORKS Flow Simulation training course from GoEngineer.
More SOLIDWORKS Flow Simulation Tutorials
Customizing SOLIDWORKS Flow Simulation Feature Tree Categories
Fastest Way to Cool a Hot Dog: SOLIDWORKS Flow Simulation Study
Understanding Flaps Using SOLIDWORKS Flow Simulation Parametric Study
SOLIDWORKS Flow Simulation Convergence Solver Quick Tip

About Tashayla Openshaw
Tashayla Openshaw is a SOLIDWORKS Technical Support Engineer based out of our Headquarters in Salt Lake City, Utah. She earned her Bachelor’s degree in Mechanical Engineering from the University of Utah in 2018 and has been part of the GoEngineer family since February 2019.
Get our wide array of technical resources delivered right to your inbox.
Unsubscribe at any time.
